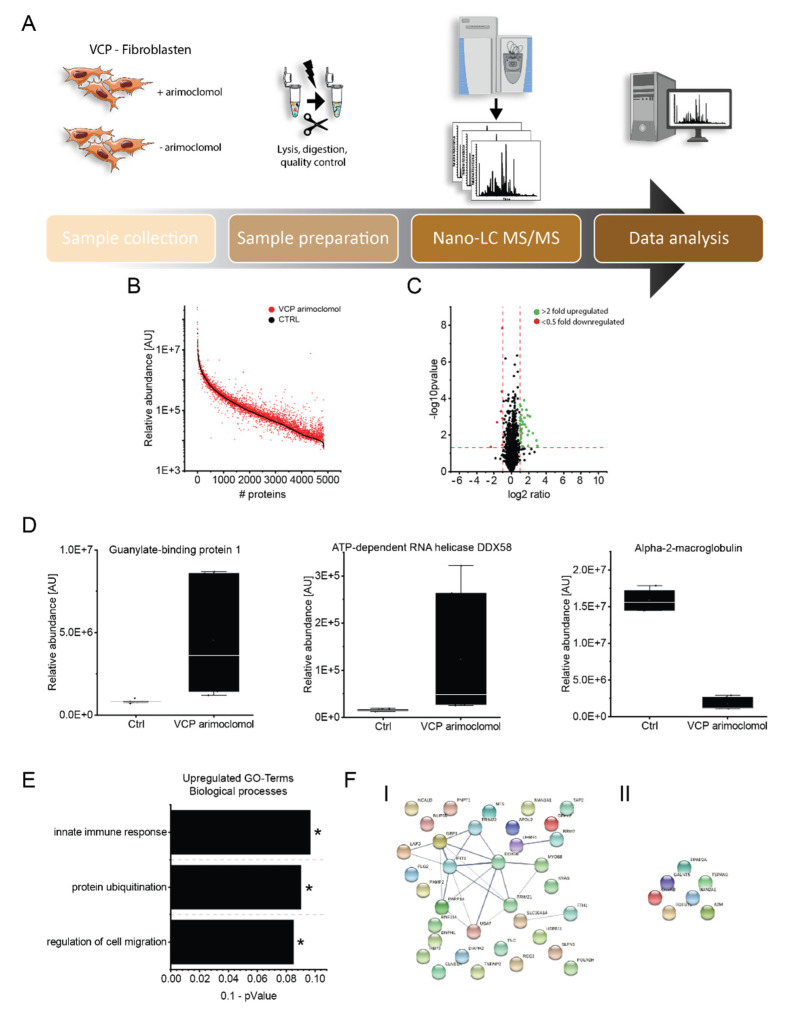
Figure 4.
Effect of arimoclomol treatment on proteostasis of VCP–mutant fibroblasts analyzed by proteomic profiling. (A) Workflow applied to biochemically address the effect of arimoclomol on proteostasis of VCP–patient derived fibroblasts. (B) Abundance plot showing the dynamic range of all identified proteins based on their relative quantification using always the 3 highest abundant peptides for each protein, allowing protein comparison within an experiment. All identified proteins of the control (black) are sorted with decreasing abundance while the patient (red) was plotted in the same order to directly compare the different abundances. All identified proteins cover a dynamic range of eight orders of magnitude. (C) Volcano plot highlighting statistically significant increased proteins (green dots) as well as decreased proteins (red dots). (D) Box plots of selected dysregulated proteins showing the increase of GBP1, DDX58 as well as decrease of A2MG upon arimoclomol exposure in VCP–mutant fibroblasts. (E) Results of the GO–term based analysis of affected biological processes based on proteins identified with increased abundance upon arimoclomol treatment of VCP–mutant fibroblasts. * indicates a p-value ≤ 0.05. (F) STRING network analysis of dysregulated proteins separated according to increased (I) and decreased (II).

