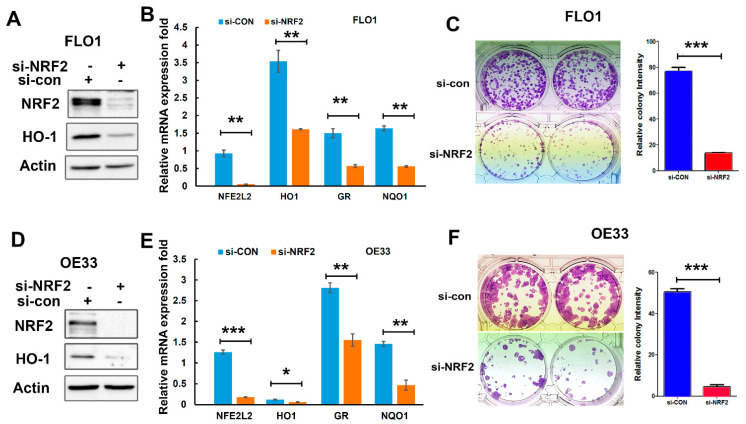
Figure 3.
Knockdown of NRF2 inhibited EAC cell growth in vitro. (A,D) Western blotting indicates protein levels of NRF2 and HO1 (an NRF2 target gene) after NRF2 knockdown using an NRF2 siRNA in FLO1 (A) and OE33 (D) cells. (B,E) Real-time qPCR shows the downregulation of NRF2 target genes (HO1, GR, and NQO1) in FLO1 (B) and OE33 (E) cells after NRF2 knockdown. (C,F) The colony formation assay demonstrated significantly fewer and smaller colonies after NRF2 knockdown in FLO1 cells (C) and OE33 cells (F). * p < 0.05; ** p < 0.01; *** p < 0.001.

