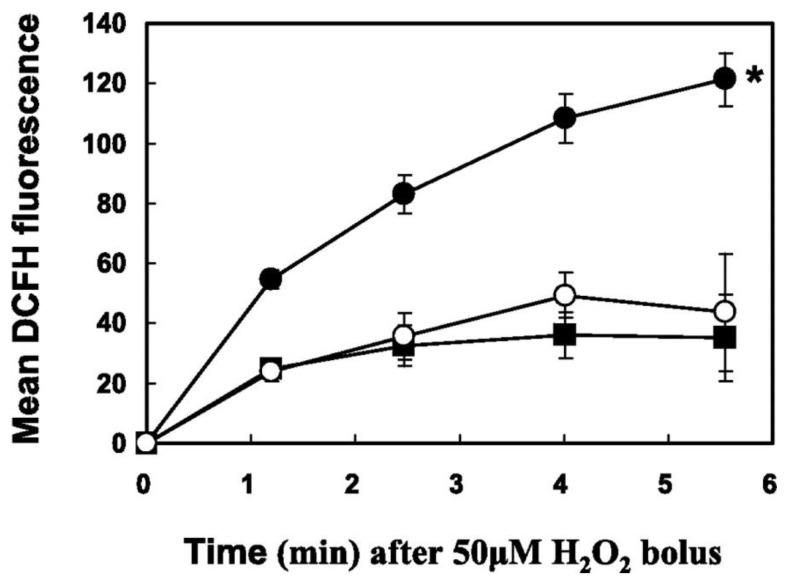
Figure 15.
H2O2 detoxification in TTase+/+, TTase−/−, and pure TTase enzyme loaded TTase−/− mouse LECs. ROS fluorescence was measured by fluorescence-activated cell sorter (FACS). The H2O2 (50 μM) treatment time course of the mean DCF fluorescence intensity was followed for TTase+/+ (■), TTase-loaded TTase−/− (O), and TTase−/− (●). Error bars indicate SD, n = 5. * Significant difference from the TTase+/+ and TTase-loaded TTase−/− cells (p < 0.05). Reprinted with permission from Lofgren et al., IOVS (2008); Copyright ARVO 2008 [109].

