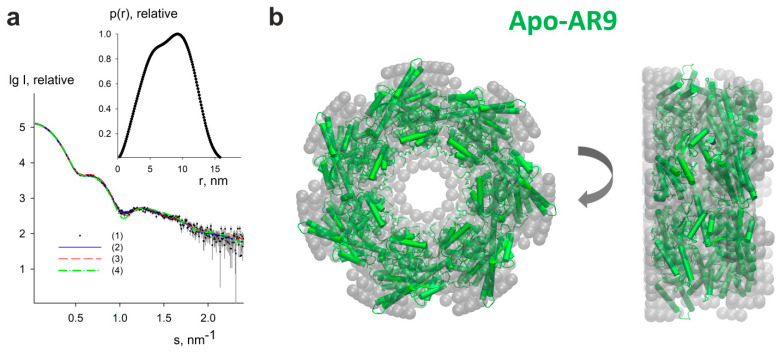
Figure 6.
SAXS study of Apo-AR9. (a) Small-angle X-ray scattering patterns from Apo-AR9 chaperonin. Curve (1)—experimental data are displayed as dots with error bars, curve (2)—the fit from ab initio model obtained by DAMMIN [32] is shown as a blue solid line, curves (3) and (4)—theoretical scattering curves calculated by CRYSOL [33] from cryo-EM models with C1 and C7 symmetry are shown as red dashed and green dashed-dotted lines, respectively. The plots display the logarithm of the scattering intensity as a function of the momentum transfer. The inset displays the distance distribution function estimated by GNOM [31]. (b) Ab initio bead model of Apo-AR9 chaperonin obtained by DAMMIN (gray semitransparent spheres) overlapped with the heptameric cryo-EM model in the cartoon representation (green color). The right view was obtained by a 90° clockwise rotation around the vertical axis. The figure was generated using the VMD program [37].

