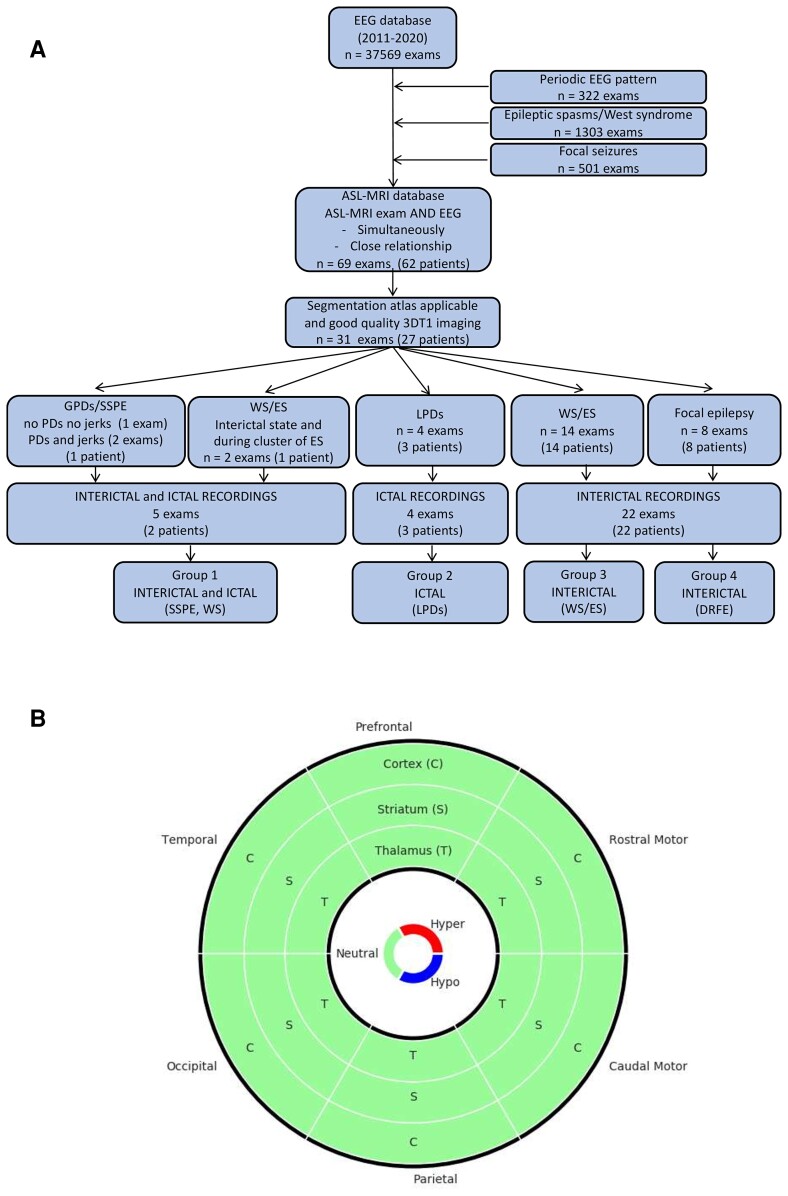
Figure 1.
Flow chart and donut chart. (A) Flow chart. Inclusion of patients and examinations. Patients and examinations were identified by screening the EEG database between January 2011 (beginning of systematic ASL-MRI recordings in our hospital) and November 2020 for patients presenting with PDs, patients with daily ES and patients with DRFE with daily seizures without history of PDs or ES. In order to assess ictal and/or inter-ictal ASL-MRI changes in these patients, we retrospectively included those who had undergone an ASL-MRI study in close temporal relationship to the video EEG, or recorded simultaneously (EEG-ASL-MRI—part of an ongoing prospective study). In patients presenting with PDs, we assumed that PDs were present during the ASL-MRI study by the fact that video EEG before and after ASL-MRI (maximum interval 7 days) were comparable, and the patients did not recover or receive additional ASM able to stop PDs. In patients with ES and DRFE with daily seizures, we included those who underwent video EEG within 1 month before/after ASL-MRI to ensure that their EEG features were still compatible with the diagnosis of their epilepsy type and syndrome. During the ASL-MRI, the status was considered as inter-ictal when no seizure was observed nor recorded (if simultaneous EEG). (B) Donut chart used to represent cortico-striatal-thalamic circuits. This chart is composed of three rings for cortex (C), striatum (S) and thalamus (T), respectively, from outside to inside. The chart is divided into six equal parts corresponding to the six subdivisions studied, clockwise: prefrontal, rostral motor, caudal motor, parietal, occipital and temporal. For each compartment, if the two-sample t-test of the studying ROI is significant (P < 0.05), the colour is red if the patient’s A-CBF (or R-CBF) value is greater than the average of the controls’ A-CBF (or R-CBF) values, blue if the patient’s A-CBF (or R-CBF) value is lower than the average of the controls’ A-CBF (or R-CBF) values, and green if the test is not significant.

