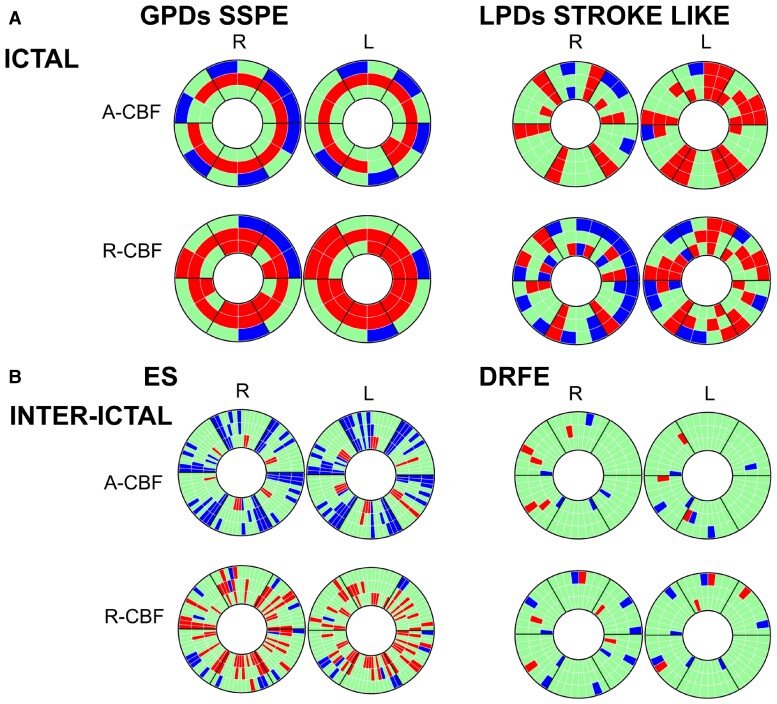
Figure 6.
Overview on donut charts in the four groups (for details, see Fig. 1B) showing significant A-CBF and R-CBF changes compared with controls. Red: increase, blue: decrease. (A) Ictal: GPDs/SSPE (left), LPDs stroke-like (right). See also Supplementary Figs. 2 and 4. (B) Inter-ictal: Epileptic spasms (left), focal epilepsy (right). See also Supplementary Figs. 5 and 6.

