Figure 1.
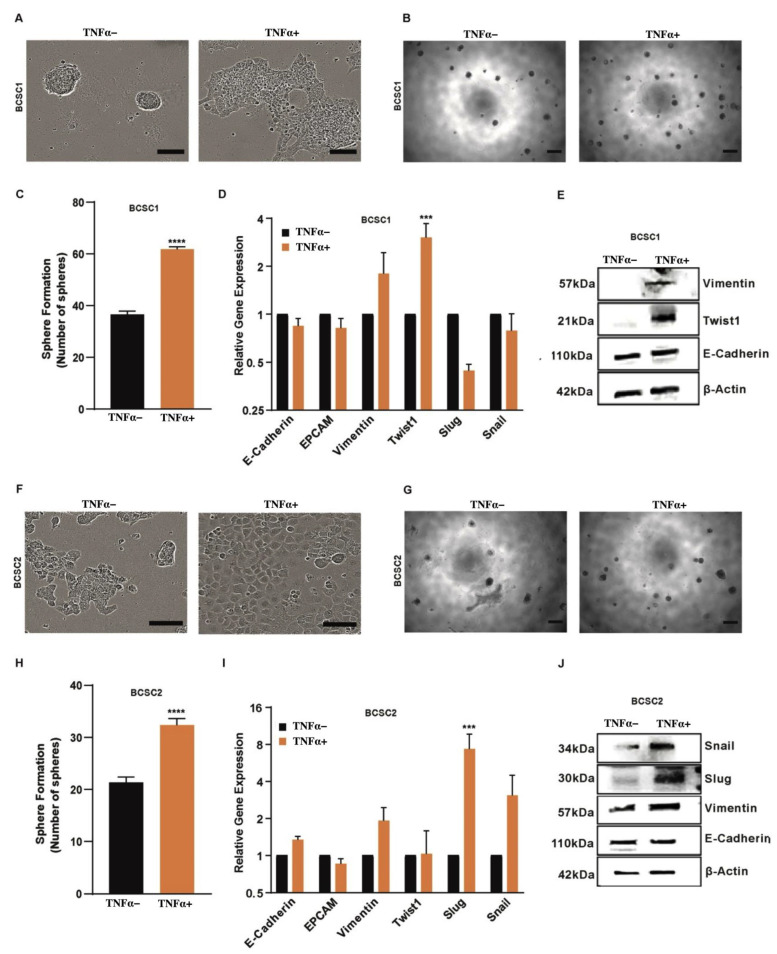
Effect of TNFα stimulation in BCSCs. (A) Morphology of untreated and TNFα-treated BCSC1. Scale bars, 20 µm. (B) Sphere forming assay of untreated and TNFα pretreated BCSC1 (n = 3). Scale bars, 37.5 µm. (C) Graphical representation of data showing the count of spheres. Data represents mean ± SEM; **** p < 0.0001 by two-tailed, unpaired Student’s t-test. (D) Relative gene analysis of indicated epithelial-to-mesenchymal transition (EMT) markers in untreated and TNFα-treated BCSC1 (n = 3). Data represents mean ± SEM; *** p < 0.001, by 2-way ANOVA. For the untreated group, data represents no error bar as data was normalized to 1 to denote the fold change. (E) Western blot analysis of EMT markers in BCSC1. (F) Morphology of untreated and TNFα-treated BCSC-2. Scale bars, 20 µm. (G) Sphere forming assay of untreated and TNFα-treated BCSC2 (n = 3). Scale bars, 37.5 µm. (H) Graphical representation of data showing the count of spheres. Data represents mean ±S EM; **** p < 0.0001 by two-tailed, unpaired Student’s t-test. (I) Relative gene analysis of indicated EMT markers in untreated and TNFα-treated BCSC2 (n = 3). Data represents mean ± SEM; *** p < 0.001, by 2-way ANOVA. For the untreated group, data represents no error bar as data was normalized to 1 to denote the fold change. (J) Western blot analysis of EMT markers in BCSC2.

