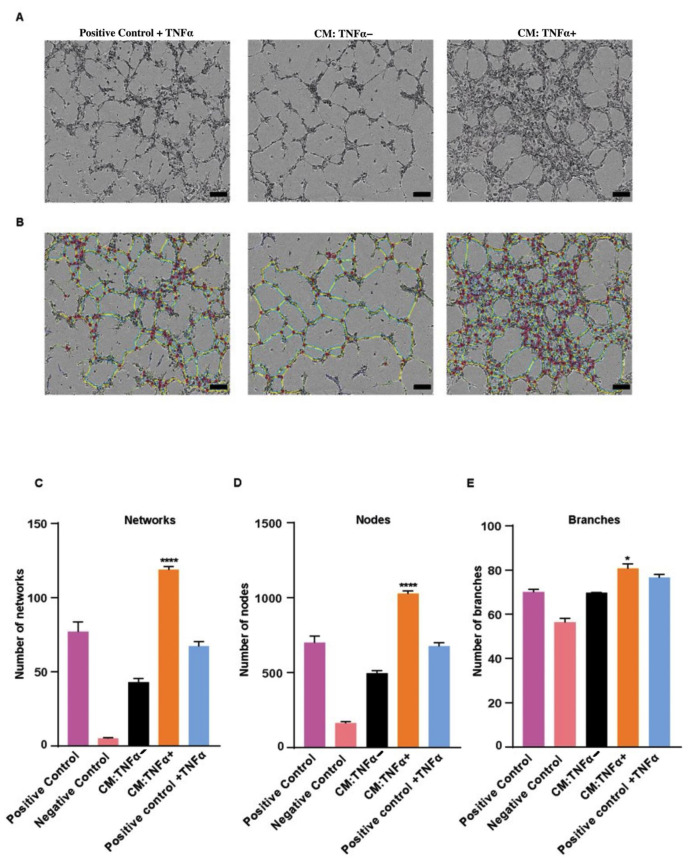
Figure 3.
Endothelial cell network forming capacity. To understand the capacity of network formation, fresh MSC medium with TNFα was used as a positive control, depleted medium was used as a negative control and conditioned media (CMs) from untreated and 10 days TNFα-treated BCSC1 were used. (A) TNFα-CM from BCSC1 promoted the tube formation of HUVECSs in vitro. Scale bars, 15 µm. (B) Representative images depicting the quantitative analysis of the tube formation. Data analysis was performed with Image-J Plugin angiogenesis analyzer. Blue color indicates the networks. Small circles indicate the nodes. Green color indicates the branches. (C–E) Graphical data demonstrating the number of networks, nodes, and branches (n = 3). Data represents mean ± SEM; * p < 0.05, **** p < 0.0001 by 1-way ANOVA.

