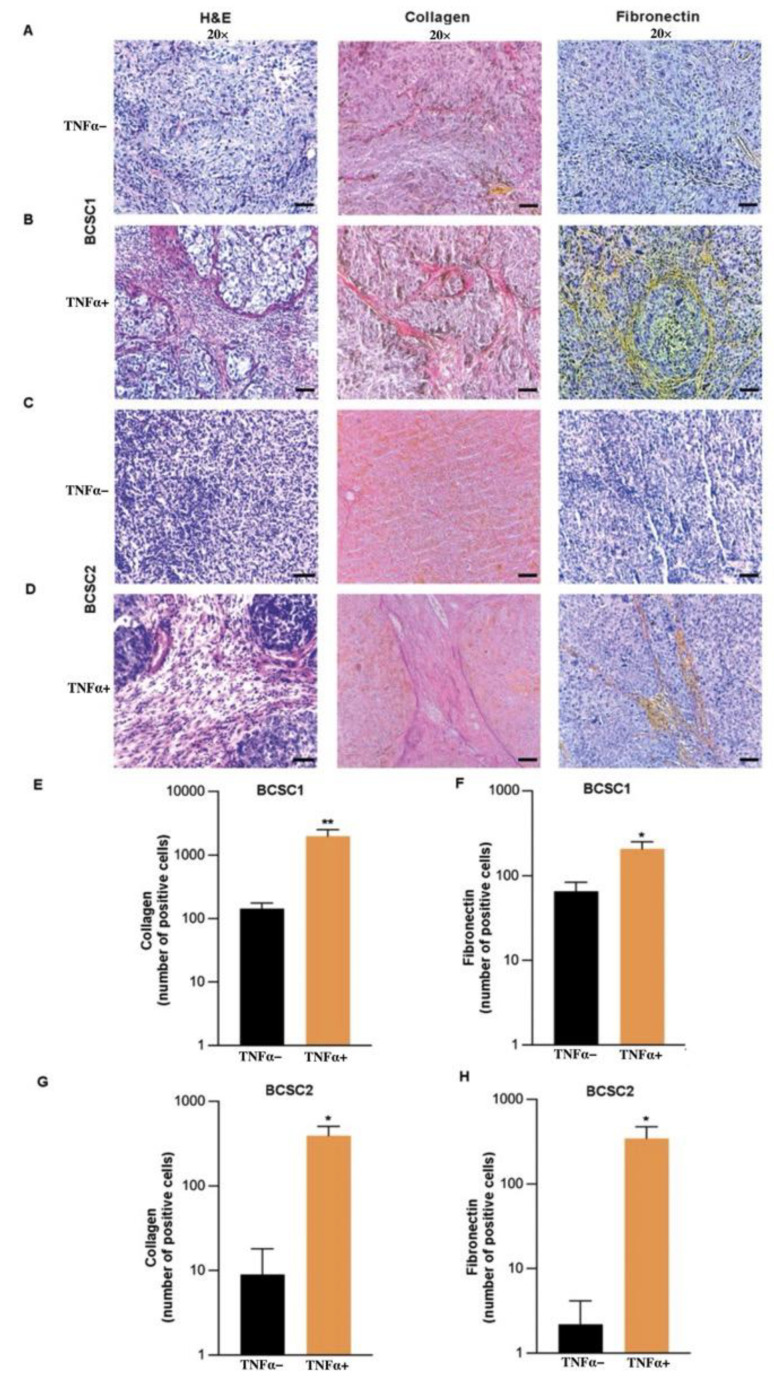
Figure 5.
TNFα induces increased fibrotic network formation in vivo. (A) H and E staining (n = 10/group), EVG staining (n = 8/group), and Fibronectin staining (n = 5/group) of the tumor tissue from the mice injected with untreated and (B) TNFα-treated BCSC1, respectively. Scale bars, 15 µm. (C) H and E (n = 6/group), EVG (n = 4/group) and Fibronectin staining (n = 5/group) of the tumor tissue from the mice injected with untreated and (D) TNFα-treated BCSC2, respectively. Scale bars, 15 µm. (E) Graphical data representing the quantification of collagen fibers and (F) fibronectin-positive cells in BCSC1 experimental group and (G) collagen fibers. (H) Fibronectin-positive cells in BCSC2 experimental group. Data represents mean ± SEM; * p < 0.05, ** p < 0.01 by two-tailed, unpaired Student’s t-test.

