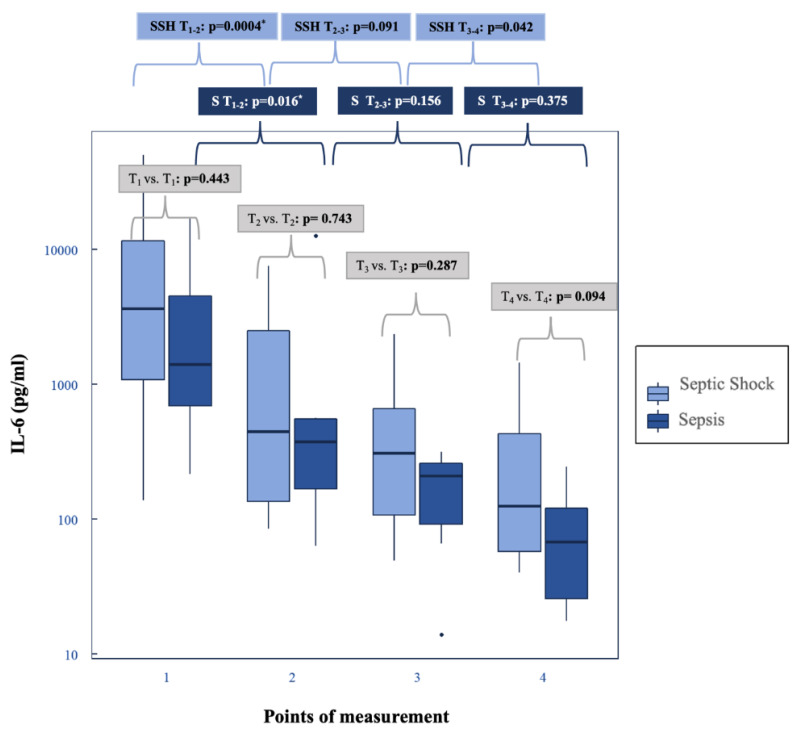
Figure 3.
IL-6: sepsis vs. septic shock and the progression in the subgroups. IL-6: LiMAx®: grey rectangle: p-values of septic shock vs. sepsis; dark blue rectangle: p-values of the subgroup sepsis (S); light blue rectangle: p-values of the subgroup septic shock (SSH); *: statistically significant. Box-whisker plot: bold lines: medians; box plots: 25th to 75th percentiles; box-whisker plots: illustrate median value with interquartile range; outliers are shown as separate points.

