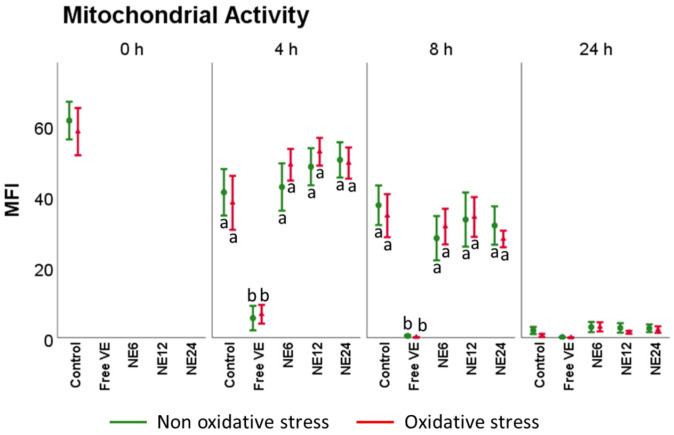
Figure 6.
Vitamin E nanoemulsions effects on mitochondrial activity. Plots show the triple interaction of different treatments of Vitamin E × oxidative treatment × incubation time for the flow cytometry analysis of mitochondrial activity (YO-PRO-1−/Mitotracker deep red+). The various lowercase Latin letters (p < 0.05) indicate significant differences between treatments of vitamin E.

