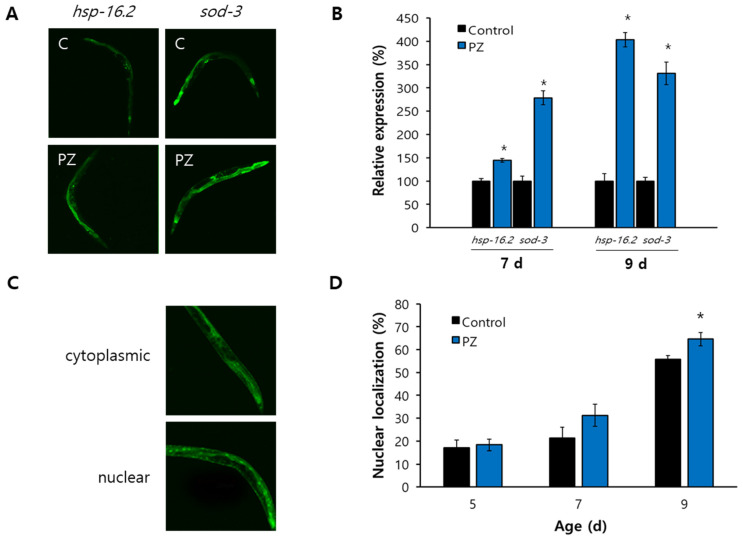
Figure 4.
Transcriptional regulation of stress-responsive genes by phlorizin. (A) GFP expression induced by either hsp-16.2 or sod-3 promoter was observed in a fluorescence microscope. (B) Quantification of fluorescence was determined using a fluorescence multi-reader. Relative percent expression is shown compared to 100% for untreated control. (C) Subcellular localization of DAF-16 fused to GFP was determined under a fluorescence microscope. (D) Percent of worms showing nuclear localization was compared between untreated control and phlorizin-treated group. Error bar indicates standard error. C, untreated control; PZ, phlorizin (10 μM); *, a significant difference (p < 0.05) compared to untreated control.

