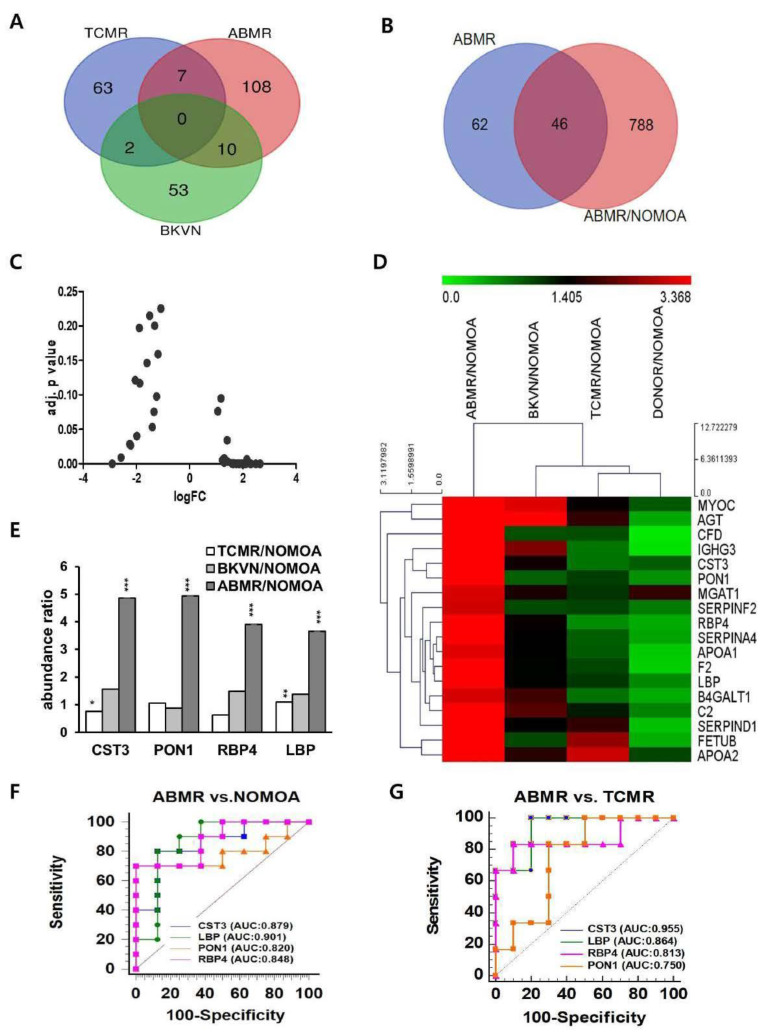
Figure 3.

Discovery of proteomic biomarker candidates using proteomic analysis. (A) A total of 262 exosomal proteins were identified, of which 125 were identified in ABMR. (B) Forty−six proteins in the overlapping portion of ABMR and ABMR/NOMOA were selected as biomarker candidates for ABMR. (ABMR = 12, TCMR = 8, BKVN = 5). (C) A volcano plot was constructed using fold−change (LogFC) values and adjusted p-values for abundance ratio. The logFC > 0 represents up-regulated genes and logFC < 0 means downregulated candidates. (D) Heatmap showing the top 18 differentially expressed genes in upregulation after excluding missing values. The differentially expressed genes were selected on the basis of FC(log2) >1.5 and adj p < 0.001. (E) The relative expression levels of top 4 candidates in the ABMR and other pathologic groups for abundance ratio. * p < 0.05 ** p < 0.01 *** p < 0.001. (F,G) The area under the receiver operating characteristic curve was calculated to discriminate ABMR from other groups in the discovery cohort. ABMR, antibody−mediated rejection; NOMOA, no major abnormality. TCMR, T cell−mediated rejection; BKVN, BK virus nephropathy; AUC, area under the ROC curve.
