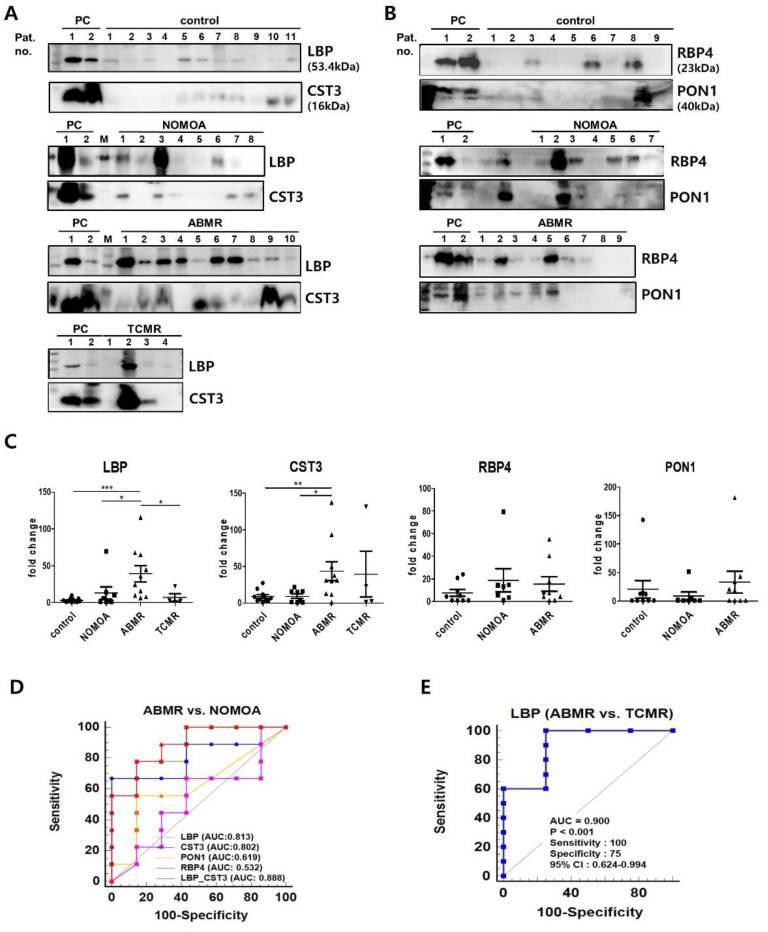
Figure 4.

Validation of urinary exosomal biomarker candidates in urine exosome. Western blot analysis of LBP (A), CST3 (A), RBP4 (B), and PON1 (B) according to pathologic groups are shown. PC refers to positive control (pooling of 2 samples from an individual subject) groups (LBP and CST3; 11 control, 8 NOMOA, 10 ABMR, and 4 TCMR, RBP4 and PON1; 9 control, 7 NOMOA, and 9 ABMR). (C) Fold changes of signal intensities from the Western blots in (A,B). The results of Western blot analysis were assessed after normalization of means for the control group. Statistical significance was determined using two−tailed Mann−Whitney U test. * p < 0.05 ** p < 0.01 *** p < 0.001. (D,E) AUC of biomarker candidates in the independent validation cohort. D. ROC curves of single and two combined proteins between NOMOA and ABMR groups. (E) ROC curve of LBP for discriminating between ABMR and TCMR. ABMR, antibody−mediated rejection; NOMOA, no major abnormality. TCMR, T cell−mediated rejection; AUC, area under the ROC curve. CST3, Cystatin C; PON1, paraoxonase/arylesterase 1; RBP4, retinol−binding protein 4; LBP, lipopolysaccharide−binding protein; AUC, area under the ROC curve; 95% CI, 95% confidence interval.
