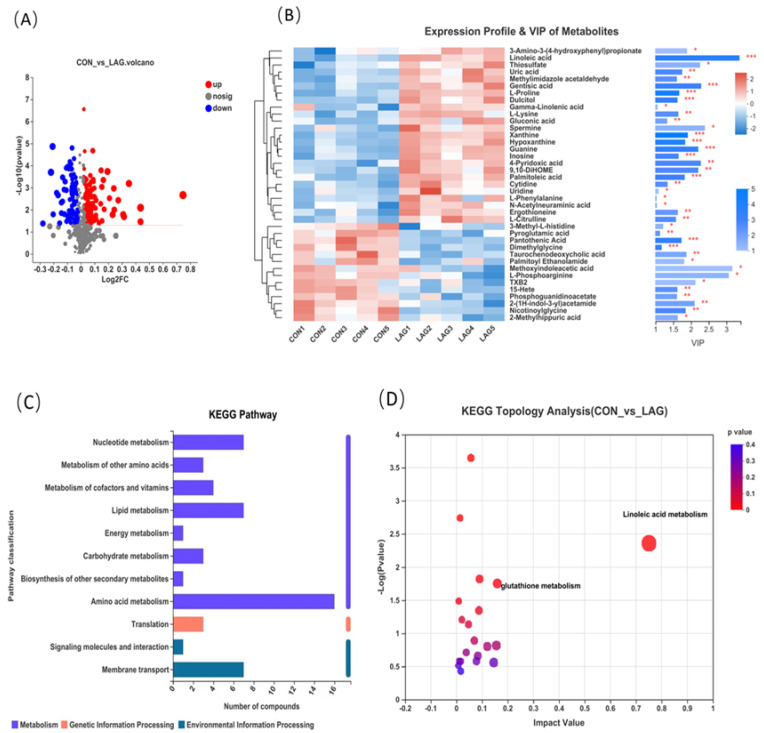
Figure 5.
(A) Differential volcano plot of CON and LAG groups, each point in the graph represents a specific metabolite and larger points indicate higher VIP values. Blue indicates significant downregulation and red indicates significant upregulation. (B) Heatmap combined with hierarchical clustering of the most significantly influenced metabolites in CON and LAG groups. Only the metabolites with the highest variable importance in projection (VIP) value in the OPLS-DA model (top 40 named metabolites) were listed. The t-test was jointly applied with the OPLS-DA to identify the discrepant metabolites and the p value in the t-test was shown. The heatmap colors represent the relative expression of metabolites in the sample, with VIP bar graphs of metabolites on the right. The bars’ length represents the metabolites’ contribution value to the difference between the two groups. The larger the value, the more significant the difference between the two groups. The bar’s color indicates the significance of the metabolite difference between the two groups (* 0.01 < p ≤ 0.05, ** 0.001 < p ≤ 0.01, *** p ≤ 0.001). (C) KEGG pathway, the ordinate, is the second classification of the KEGG metabolic pathway and the abscissa is the number of metabolites annotated to the pathway. (D) KEGG topology analysis. Each bubble in the figure represents a KEGG Pathway; the horizontal axis represents the relative importance of the metabolites in the pathway and the size of the Impact Value; the vertical axis represents the enrichment significance of metabolites involved in the pathway-log10 (p-value); bubbles of the size represents the Impact Value; the larger the bubble, the greater the importance of the pathway.

