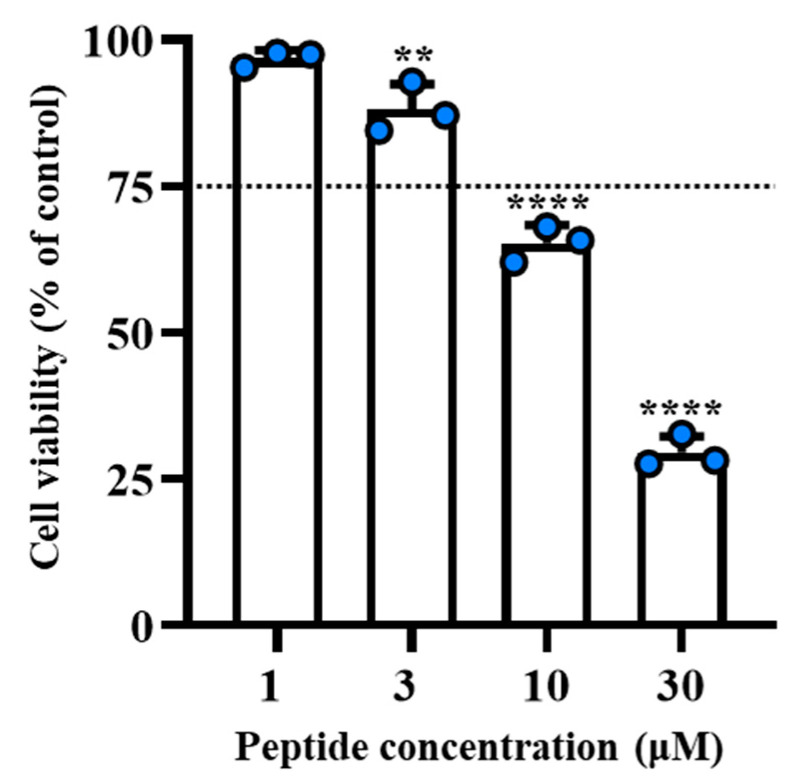
Figure 5.
In vitro cytotoxic examination for [Nle1, dLeu9, dLys10] at concentrations of 1–30 μM was performed on J774A.1 murine macrophage cells. Dotted lines indicate the 75% of cell viability. Values are presented as means ± S.D. of 3 independent experiments. ** p ≤ 0.01, **** p < 0.0001 vs. Ctrl group (100%). Statistical analysis was performed by one-way ANOVA followed by Bonferroni’s for multiple comparisons.

