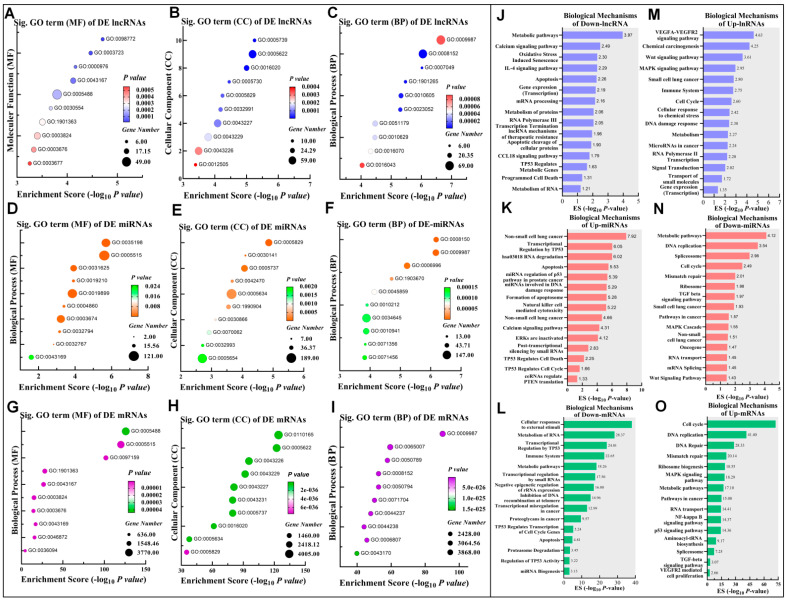
Figure 2.
Biological profiles of DE lncRNA, miRNA, and mRNA transcripts. (A) Top significant GO terms of linked MF DE lncRNA profile. (B) Top significant CC. (C) Top significant BP of DE lncRNA profile. (D–F) Top significant MF, CC, and BP from the DE miRNAs, respectively. The top significant terms of MF, CC, and BP from the DE mRNAs are represented in (G–I), respectively. The top significant biological pathways of down-lncRNA, up-miRNA, and down-mRNA (tumor suppressor axis) are shown in (J–L). The significant biological pathways of the oncogenic axis of Up-lncRNA, Down-miRNA, and Up-mRNA are represented in (M–O). The dot size reflects the number of shared genes in each biological function and the dot two-color system indicates the p-values.

