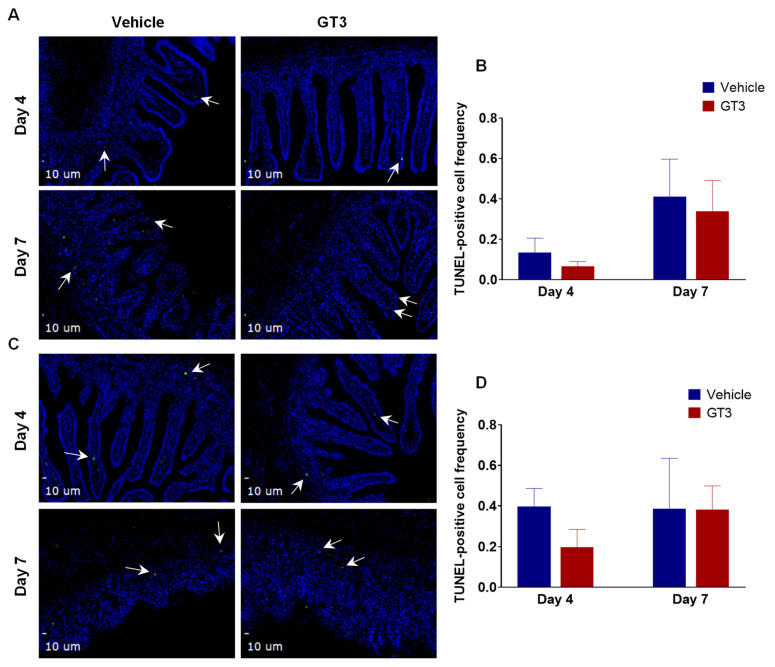
Figure 4.
Effects of PBI on cell death in the proximal jejunum. (A) Representative photomicrograph of TUNEL-positive cells (green) in the jejunal villi. (B) Frequency of TUNEL-positive cells in villi at days 4 and 7 post-PBI. (C) Representative photomicrograph of TUNEL-positive cells (green) in the crypt. (D) Frequency of TUNEL-positive cells in the crypts at days 4 and 7 post-PBI. TUNEL-positive cells are shown by white arrows. The data are presented as average ± SEM; N = 3 (day 4) and N = 5 (day 7).

