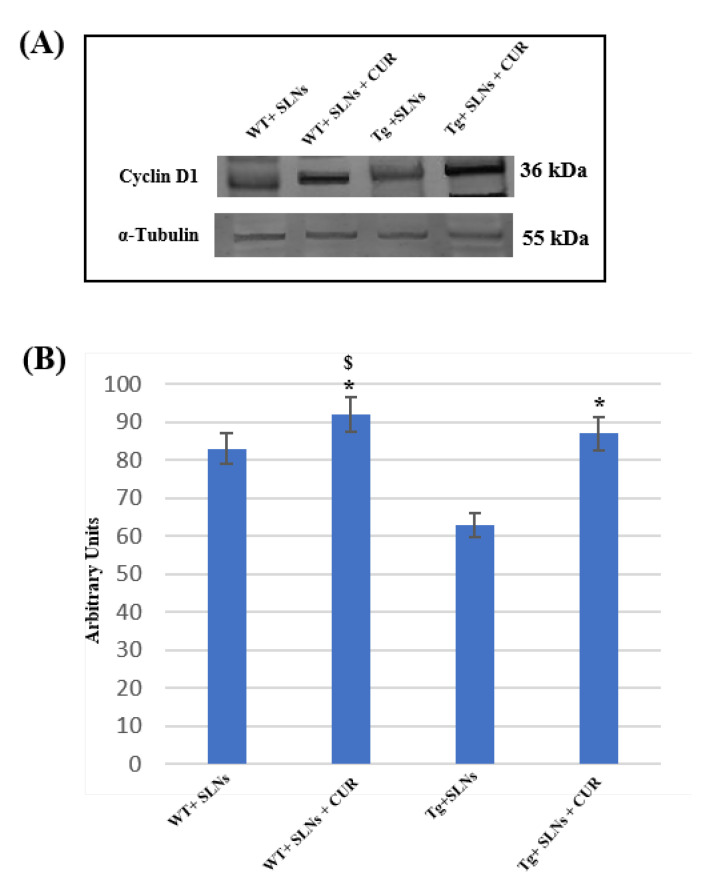
Figure 3.
(A) Representative immunoblots through Western blotting analysis for Cyclin-D1 expression levels in total cellular lysate from WT-SLNs, WT-SLNs-CUR, Tg-SLNs, and Tg-SLNs-CUR mice systemically administrated for 3 weeks. (B) Densitometric analysis of Cyclin-D1 expression levels performed after normalization with α-tubulin. The results are expressed as the mean ± S.D. of the values of five separate experiments performed in triplicate. * p < 0.05, Tg-SLNs-CUR vs. Tg-SLNs; $ p < 0.05.

