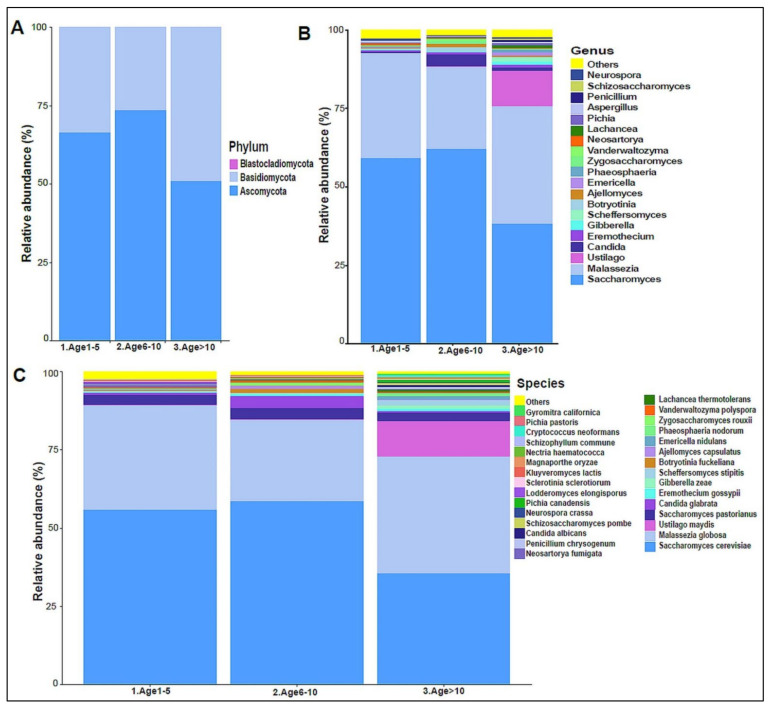
Figure 7.
The urinary mycobiome and age groups. Y-axis shows % of relative abundance; X-axis indicates the fungal abundance in the three age groups. A different color shows each taxonomic category: (A) at the phylum level, (B) at the genus level, (C) at the species level. Age 1–5 (n = 10), Age 5–10 (n = 19), and Age > 10 (n = 11).

