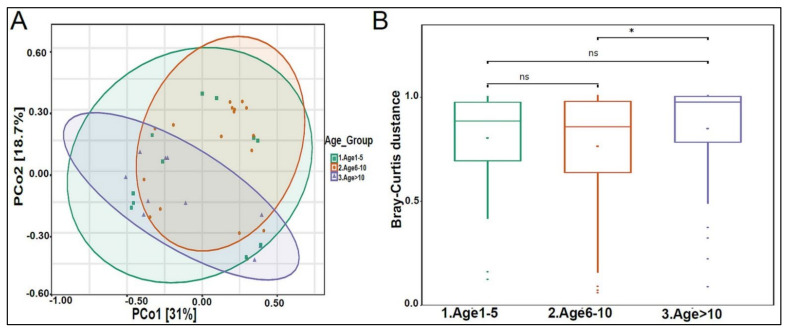
Figure 8.
Beta diversity of urinary mycobiome between age groups. (A) Principal Coordinate Analysis (PCoA) based on Bray-Curtis dissimilarities of urinary mycobiome. Axes are scaled to the amount of variation explained; (B) boxplots of Bray-Curtis distance matrix among the three groups. Age 1–5 (green), Age 6–10 (orange), and Age > 10 (purple). Not significant (ns). * p < 0.05.

