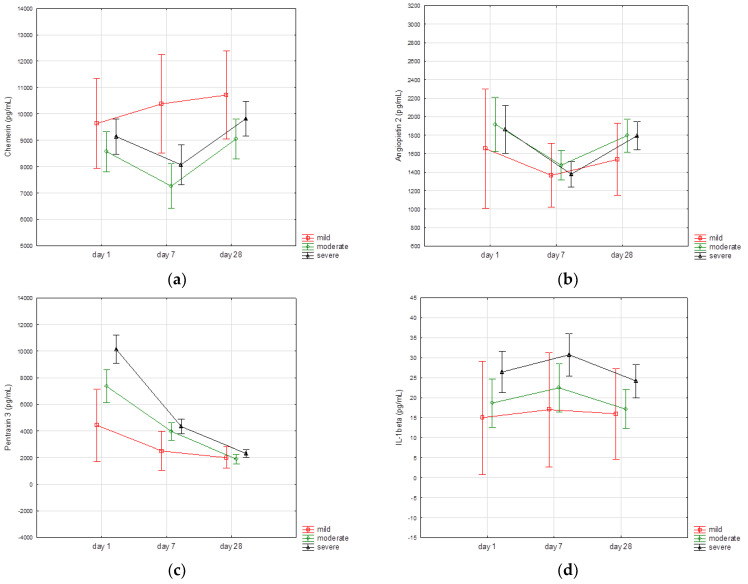
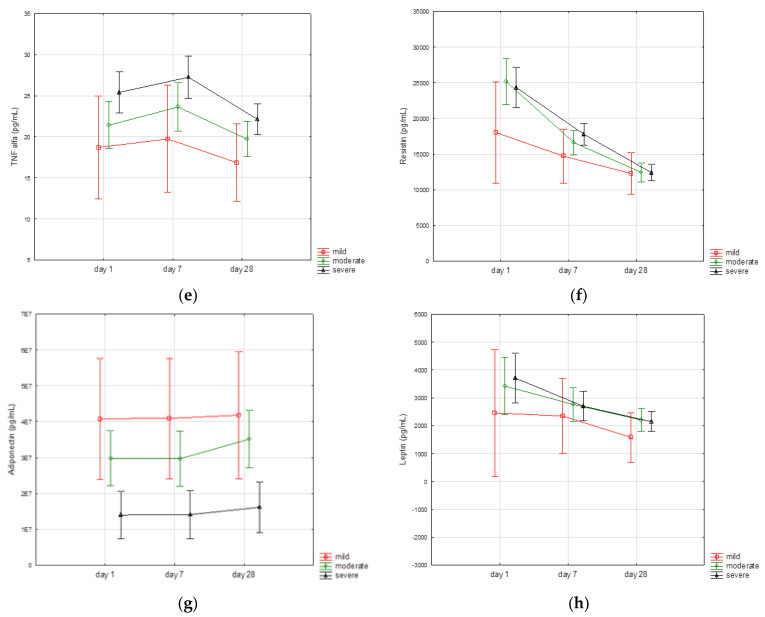
Figure 1.
Time course of biomarker concentrations according to the clinical spectrum of SARS-CoV2 infection. (a) Chemerin; (b) angiopoietin 2; (c) Pentraxin 3; (d) IL-1β; (e) TNFα; (f) resistin; (g) adiponectin; and (h) leptin. Vertical bars represent 95% confidence intervals for the mean. Il-1β, interleukin 1 beta; TNFα, tumor necrosis factor alfa.


