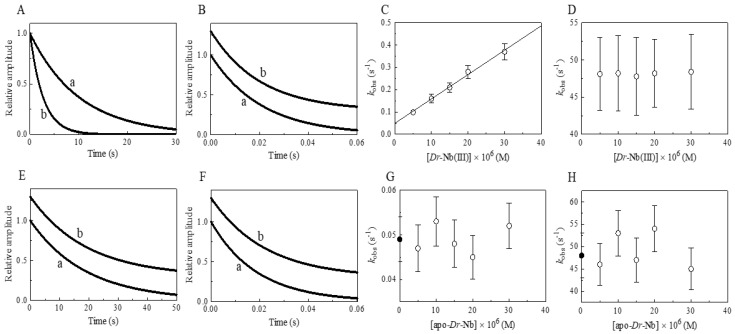
Figure 3.
Effect of Dr-Nb(III) on the kinetics for peroxynitrite isomerization, at pH 8.5 and 22.0 °C. (A) Averaged time courses of the Dr-Nb(III)-catalyzed isomerization of peroxynitrite in the absence of CO2. The time course analysis according to Equation (1) allowed us to determine the following values of kobs: trace a, 1.0 × 10⁻¹ s−1, R = 0.998; trace b, 3.7 × 10⁻¹ s−1, R = 0.999. The Dr-Nb(III) concentration was: trace a, 1.0 × 10⁻⁵ M; trace b, 3.0 × 10⁻⁵ M. (B) Averaged time courses of the Dr-Nb(III)-catalyzed isomerization of peroxynitrite in the presence of CO2. The time course analysis according to Equation (1) allowed us to determine the following values of kobs: trace a, 4.8 × 101 s−1, R = 0.999; trace b, 4.8 × 101 s−1, R = 0.998. The Dr-Nb(III) concentration was: trace a, 1.0 × 10⁻⁵ M; trace b, 3.0 × 10⁻⁵ M. The CO2 concentration was 1.2 × 10⁻³ M. For clarity, trace b has been up-shifted of 0.3 units. (C) Dependence of kobs on the concentration of Dr-Nb(III) in the absence of CO2. Data were analyzed according to Equation (2) with values of kon = 1.1 × 10⁴ M−1 s−1 and k0 = 4.9 × 10⁻²; R = 0.995, p = 0.0002. (D) Dependence of kobs on the concentration of Dr-Nb(III) in the presence of CO2. (E) Averaged time courses of peroxynitrite isomerization by apo-Dr-Nb in the absence of CO2. The time course analysis according to Equation (1) allowed us to determine the following values of kobs: trace a, 5.3 × 10⁻² s−1; trace b, 5.2 × 10⁻² s−1. The apo-Dr-Nb concentration was: trace a, 1.0 × 10⁻⁵ M; trace b, 3.0 × 10⁻⁵ M. For clarity, trace b has been up-shifted of 0.3 units. (F) Averaged time courses of peroxynitrite isomerization by apo-Dr-Nb in the presence of CO2. The time course analysis according to Equation (1) allowed us to determine the following values of kobs: trace a, 5.3 × 101 s−1; trace b, 4.5 × 101 s−1. The apo-Dr-Nb concentration was: trace a, 1.0 × 10⁻⁵ M; trace b, 3.0 × 10⁻⁵ M. For clarity, trace b has been up-shifted of 0.3 units. The CO2 concentration was 1.2 × 10⁻³ M. (G) Dependence of kobs on the concentration of apo-Dr-Nb in the absence of CO2. The symbol on the ordinate indicates the value of k0: 4.9 × 10⁻² s−1. The average value of kobs obtained in the presence of apo-Dr-Nb is: 4.9 × 10⁻² s−1. (H) Dependence of kobs on the concentration of apo-Dr-Nb in the presence of CO2. The symbol on the ordinate indicates the value of k0: 4.8 × 101 s−1. The average value of kobs obtained in the presence of apo-Dr-Nb and CO2 is 4.9 × 101 s−1. In panels D, G, and H the differences among the kobs values are not statistically significant. The peroxynitrite concentration was 2.0 × 10⁻⁴ M. The HCO3− concentration was 5.0 × 10⁻¹ M. Where not shown, the standard deviation is smaller than the symbol.

