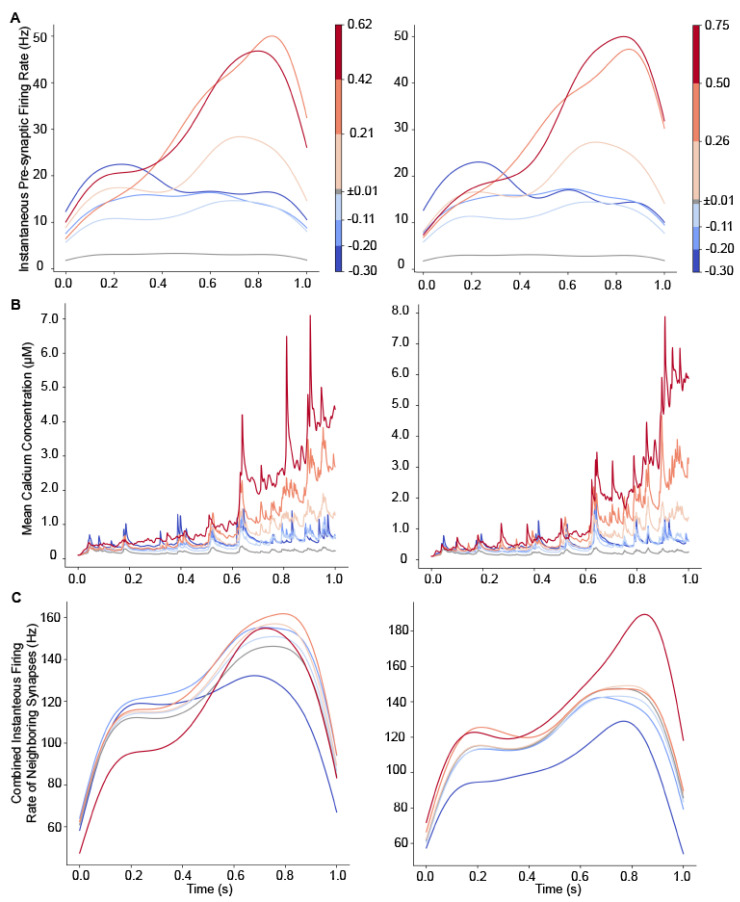
Figure 7.
Temporal pattern of input predicts weight change for different variations of the mapping from spike trains to synapses. Weight change triggered average pre-synaptic firing rate and calcium concentration for two different sets of mappings from spike trains to synapses. (A) Weight change triggered pre-synaptic firing rate for two different sets of 24 different mappings. Synapses that potentiate have a transiently high firing rate at the end of the trial. (B) Calcium concentration for two different sets of 24 different mappings. Calcium concentration determines direction of plasticity as shown by the weight-change-triggered-average. Regardless of whether peak synaptic firing rate occurs early or late in the trial, calcium concentration is highest during the second half of the trials. (C) Weight change triggered pre-synaptic firing rate of 19 neighboring synapses. For synapses in each weight change bin, the spike trains for the 19 neighboring synapses are combined into a single train, and then instantaneous firing rate is calculated from that single train.

