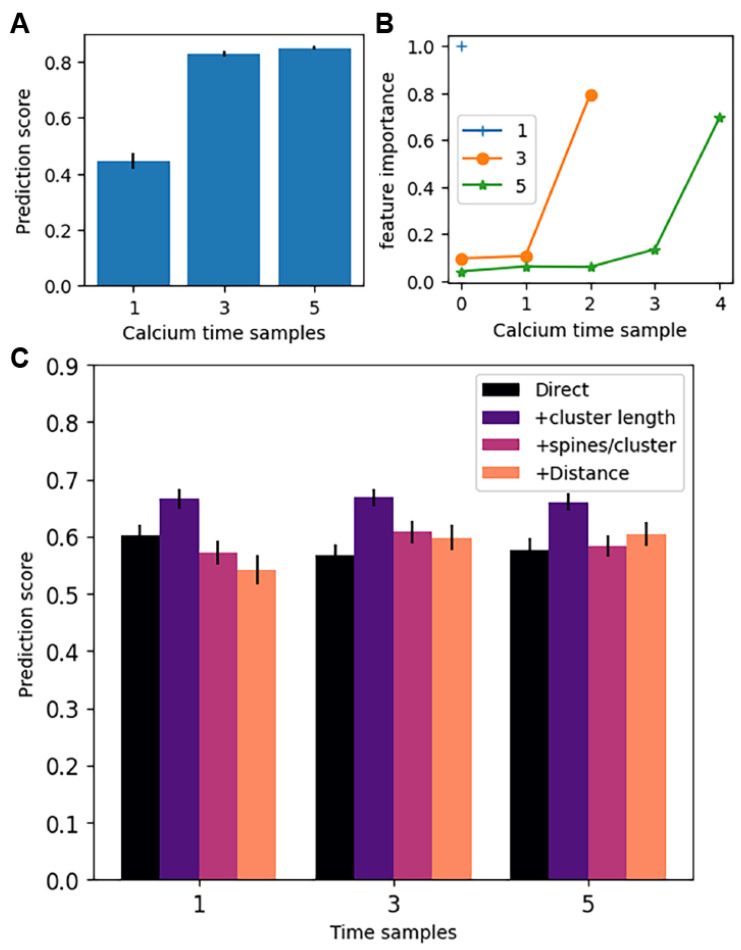
Figure 9.
Spatiotemporal characteristics predict weight change. Prediction score is the coefficient of determination, R, of the predicted weight change for the test set. For each of 5 sets of 25 simulations, we used 75% of the data as the training set and the remainder as test set, repeated 4 times giving a total of 20 regressions for each combination of features. Error bars show 1 standard error. (A) ANOVA shows that increasing number of time samples of calcium concentration improves the prediction score (F(2,60) = 165.7, p = 1.78 × 10⁻²⁴). Post-hoc t-test shows that 3 samples is significantly better than 1 sample (p = 2.84 × 10⁻¹⁵). (B) Feature importance shows that the last calcium time sample is the most important for predicting weight change. Note that the feature importances must sum to 1, so the feature importance for one calcium time sample is 1.0 by default. (C) A second set of random forest regressions used time samples of pre-synaptic firing frequency (direct) plus one other feature. An ANOVA on the other feature (none, cluster length, spines per cluster, and distance to soma) was significant (F(3,236) = 12.89, p = 7.88 × 10⁻⁸). Post-hoc t-test shows that cluster length, but no other feature, significantly improved the prediction score (p = 2.2 × 10⁻⁷).

