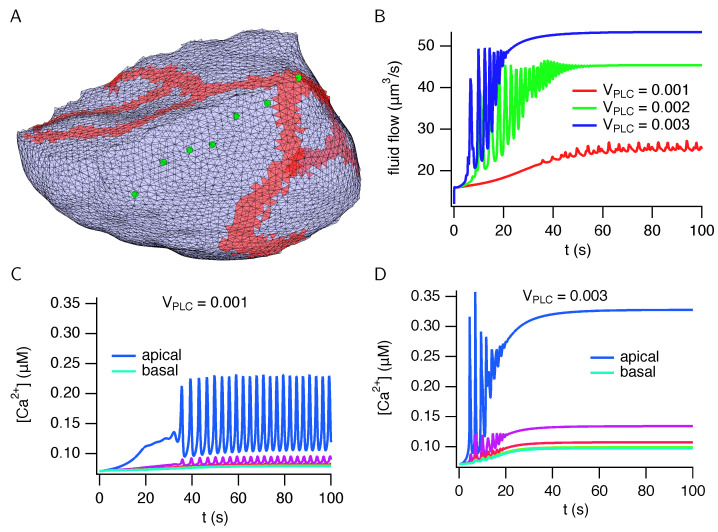
Figure 8.
Calcium responses and fluid flow in a cell (cell 1) reconstructed from anatomical data. (A): the cell membrane, showing the triangles used in the finite element mesh. Red triangles are apical membrane and blue triangles are basolateral membrane. The green circles show the places for which the responses are plotted in panels (C,D). (B): total fluid flow plotted over time for three different stimulation levels. (C,D): responses from six different positions in the cell, denoted by the green circles in (panel A).

