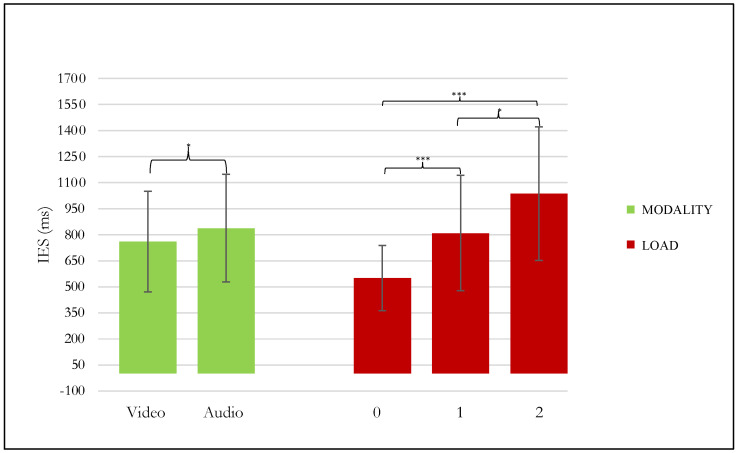
Figure 3.
The graph shows the significantly different ANOVA behavioral results of inverse efficiency score (IES) in milliseconds (ms) according to LOAD (the 3 levels of the n-back verbal working memory task) and MODALITY (video and audio) conditions. Significant differences between verbal working memory (VWM) load and modality conditions emerging from the post hoc test are indicated (* p ≤ 0.05; *** p ≤ 0.001).

