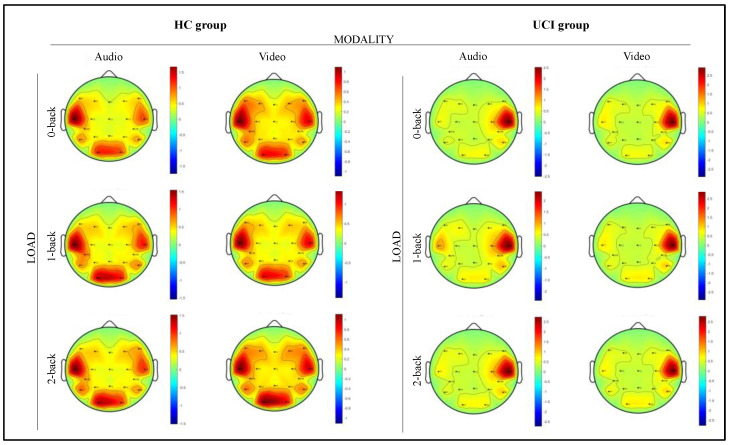
Figure 6.
Scalp distribution of the Electroencephalographic (EEG) gamma spectral power during the audio and video n-back tasks. Taped to the left is the gamma activation of the hearing control (HC) group, and to the right, those of the unilateral cochlear implant (UCI) group. For each group from left to right, the scalp maps correspond to the MODALITY (audio and video) and LOAD (0, 1, 2 level) n-back verbal working memory (VWM) task conditions. The black dots correspond to the electrode positions.

