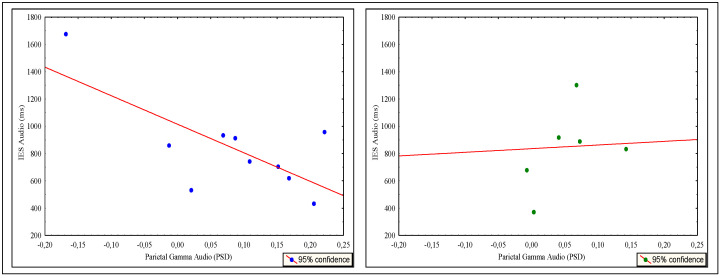
Figure 8.
Scatterplot of auditory inverse efficiency score (IES) as predicted by parietal gamma activation across the hearing control (HC) group (n = 10) (left, blue dots) and not predicted across the unilateral cochlear implanted (UCI) group (n = 7) (right, green dots). Simple linear regression explained 50.6 % of the variance in IES performance based on parietal gamma activity during the auditory n-back task for the HC group.

