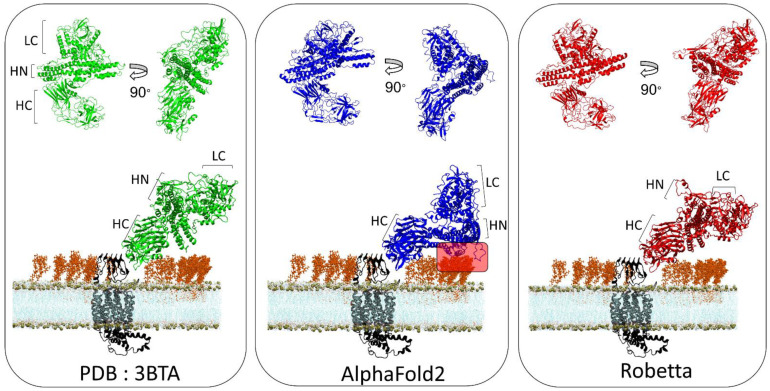
Figure 5.
Structural comparison of the spatial organization of the domains of botulinum neurotoxin A obtained from Xray diffraction (PDB: 3BTA) (left), AlphaFold2 (middle) and Robetta (right) and molecular modeling of each structure with its membrane receptor human synaptic vesicle glycoprotein C (h-SV2C) in a neural membrane context. The toxin receptor h-SV2C is depicted as a cartoon colored in black. The phosphate atom of each POPC lipid is shown as brown spheres. GT1b molecules are represented as orange sticks and the lipid tail of POPC molecules are shown as thin blue lines.

