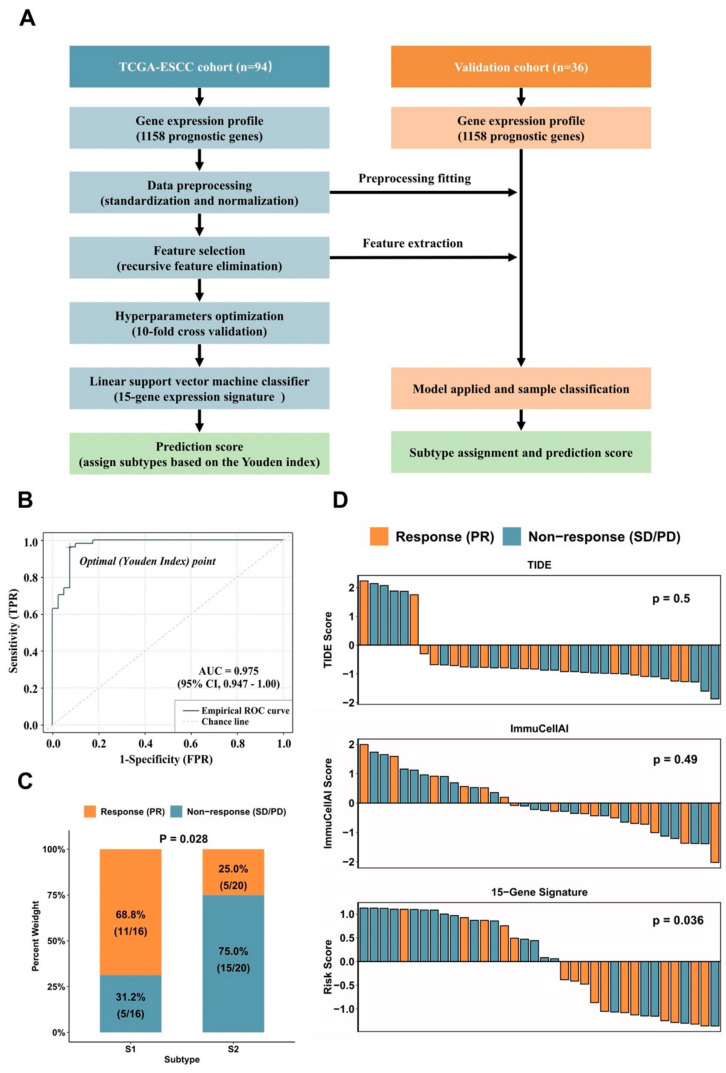
Figure 4.
Identification and validation of a 15-gene expression signature. (A) Flow chart of the 15-gene expression signature identification. (B) The ROC curve of the 15-gene expression signature in the validation set. (C) Response rates between S1 and S2 subtypes. (D) Waterfall plots of prediction scores of TIDE, ImmuCellAI and 15-gene expression signature across 36 ESCC patients treated with ICIs. ROC, receiver operating characteristic; AUC, area under the curve; ESCC, esophagus squamous cell carcinoma; ICIs, immune checkpoint inhibitors.

