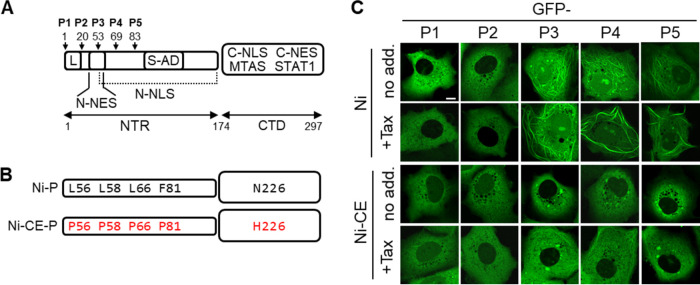
FIG 1.
RABV P3 to P5, but not P1 and P2, associate with MTs. (A) Schematic representation of RABV P1 protein; four N-terminally truncated isoforms (P2 to P5) are generated in infected cells by translation from internal in-frame AUG codons (17). Start sites are indicated by arrows, with residue numbers corresponding to position in P1. The CTD (containing the MTAS, C-NLS, C-NES, and STAT1-binding regions) and NTR (containing the S-AD, N-NLS, N-NES, and L-binding region) are indicated. (B) Residues at positions 56, 58, 66, 81, and 226 differ between P proteins from the Ni and Ni-CE strains of RABV (substitutions in Ni-CE P3 are shown in red). (C) COS-7 cells were transfected to express the indicated proteins and were treated with (+Tax) or without (no add.) paclitaxel (1 μg/mL, 4 h) before analysis by live-cell CLSM; each image is representative of the MT phenotype in cells observed in 15 fields of view sampled over two independent assays. Scale bar = 5 μm.

