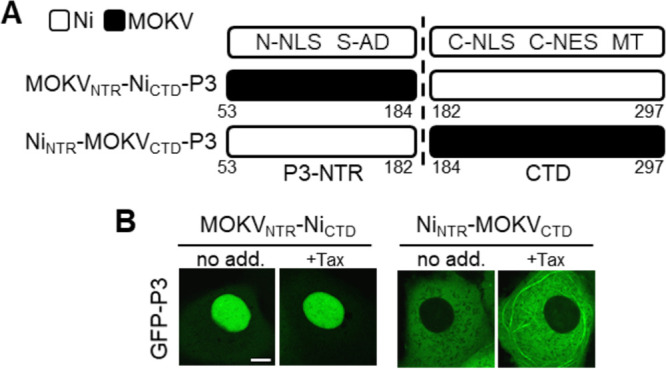
FIG 4.

The unique subcellular localization phenotype of MOKV P3 involves the NTR and CTD. (A) Schematic representation of Ni-MOKV P3 chimeras generated. (B) Live-cell CLSM images of COS-7 cells transfected to express the indicated proteins and treated with (+Tax) or without (no add.) paclitaxel before analysis by live-cell CLSM. Images are representative of cells observed in 13 fields of view sampled over two independent assays. Scale bars = 5 μm.
