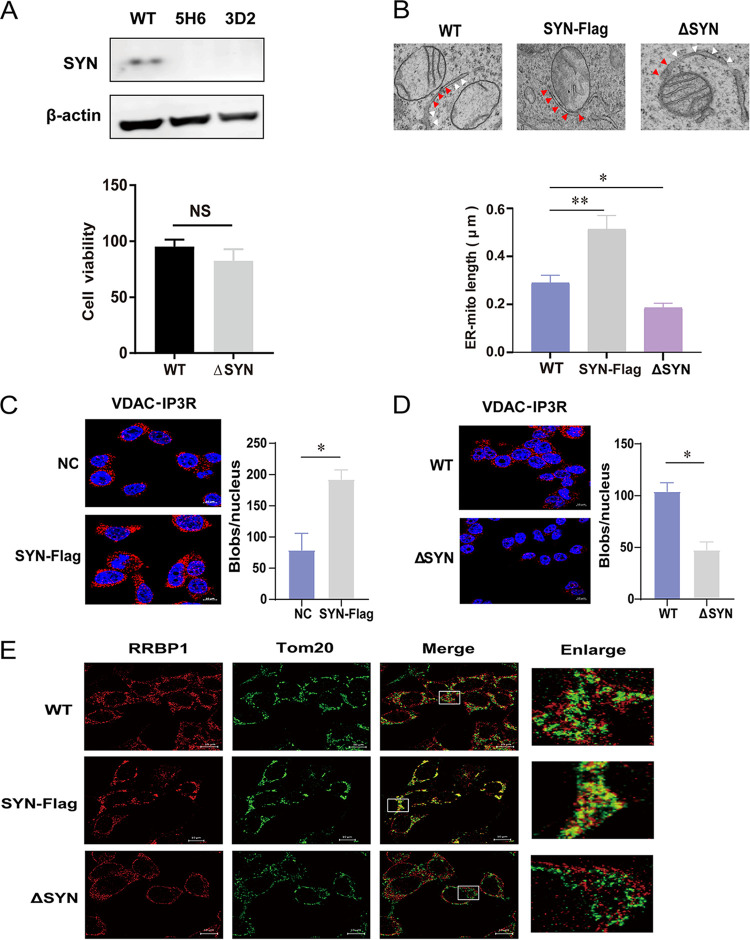
FIG 2.
Assay of MAMs in cells overexpressing SYNJ2BP or KO HEK293T cells. (A) Wild-type HEK293T cells (WT 293T) were transfected with plenti-CRISPRv2GFP vector (a plasmid expressing GFP and Cas9) and gRNAs targeting SYNJ2BP to generate SYNJ2BP knockout cells (ΔSYN). The endogenous proteins from WT 293T cells and ΔSYN cells were identified using Western blotting with antibodies against β-actin and SYNJ2BP. 5H6 and 3D2 represent two different KO cell clones. This experiment was performed three times. A histogram representing cell viability is shown. The viability of WT and ΔSYN 293T cells was assessed using a Cell Counting Kit-8 (CCK8), in which WST-8 [2-(2-methoxy-4-nitrophenyl)-3-(4-nitrophenyl)-5,2,(4-disulfophenyl)-2H-tetrazolium, monosodium salt] produces a water-soluble formazan dye upon reduction in the presence of an electron mediator. The data represent the means ± the SEM from three independent experiments (NS, P > 0.05). (B) Electron micrographs of changes in the connections between mitochondria and the ER in SYNJ2BP-Flag overexpression (SYN-Flag) and ΔSYN 293T cells. In the images, the red arrows indicate the connections between mitochondria and ERs (MAMs), and the white arrows indicate the part of the ER not connected to mitochondria. Compared to WT cells, more connections (MAMs) can be seen in SYN-Flag cells, and fewer connections (MAMs) can be seen in ΔSYN cells. The lengths of connections between mitochondria and the ER are presented in the histogram. The data represent the means ± the SEM from 15 cells of three independent experiments (**, P < 0.01; *, P < 0.05). (C and D) Proximity ligation assay to quantify the overlap between mitochondria and the ER (MAMs). The endogenous marker proteins VDAC (mitochondria) and IP3R (ER) were detected in NC and SYN-Flag 293T cells (C) or WT and ΔSYN 293T cells (D). The red dots represent interactions between VDAC and IP3R in situ (at distances <40 nm). DAPI staining (blue) was performed to visualize nuclei (scale bar, 10 μm). The numbers of red dots (blobs/nucleus) are presented in the histogram. The data represent the means ± the SEM from 30 cells in three independent experiments (*, P < 0.05). (E) WT and ΔSYN 293T cells transfected with empty vector or SYN-Flag were fixed and incubated together with anti-RRBP1 (ER) and anti-Tom20 (mitochondria) antibodies, followed by staining with secondary antibodies coupled to a fluorochrome. The signal was detected using a direct stochastic optical reconstruction microscopy (dSTORM) method. Single-molecule localization data from stained sections were captured and processed using high resolution light microscopy (ELYRA PS.1; Zeiss; scale bar, 10 μm). This experiment was performed three times.

