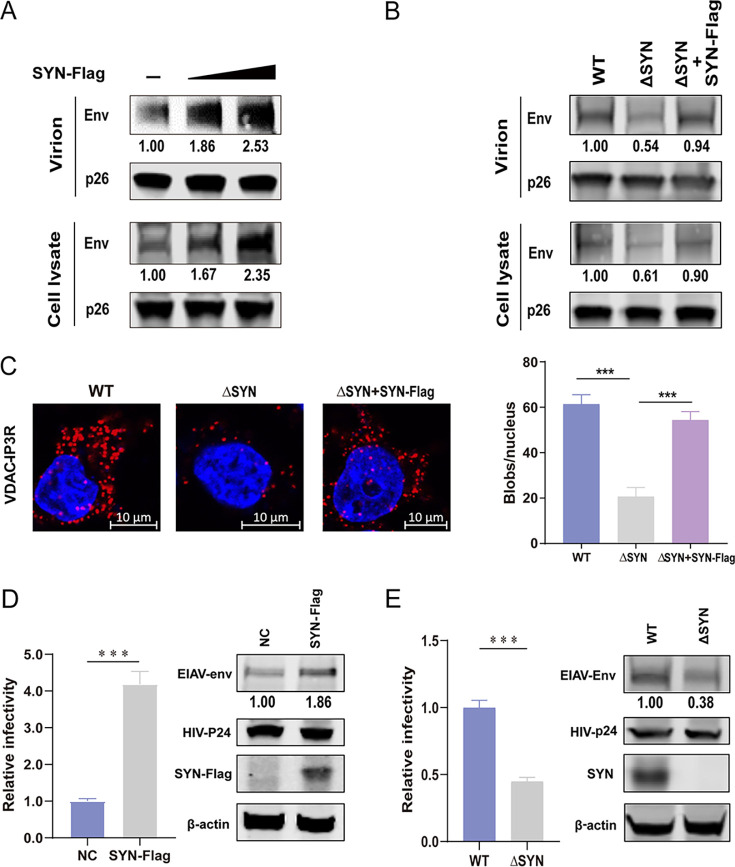
FIG 3.
Analysis of EIAV replication in cells overexpressing SYNJ2BP or KO HEK293T cells. (A) 293T cells were cotransfected with EIAV infectious clone (EIAVCMV3-8) and empty vector or SYN-Flag in three doses. (B) WT and ΔSYN 293T cells were cotransfected with EIAVCMV3-8 and empty vector or SYN-Flag. For panels A and B, cell lysates and virion-containing supernatants were analyzed by Western blotting to detect the intensity of viral Env and p26 (EIAV CA) protein bands at 48 hpt. This experiment was performed three times. The results of the densitometry analysis to quantify the ratio of Env to p26 are shown at the bottom (lane 1 set as 1.0). (C) PLA to quantify the overlap between mitochondria and ER (MAM) in WT and ΔSYN 293T cells cotransfected with EIAVCMV3-8 and empty vector or SYN-Flag. The red dots represent the interactions between VDAC and IP3R in situ (at distances of <40 nm); DAPI staining (blue) was performed to visualize nuclei (scale bar, 10 μm). The number of red dots (blobs/nucleus) is presented in the histogram. The data represent the means ± the SEM from 30 cells in three independent experiments (***, P < 0.001). (D) Overexpression of SYNJ2BP increased the infectivity of a luciferase-expressing HIV-EIAV pseudotyped reporter virus. HEK293T cells were cotransfected with either SYN-Flag or an empty vector, the HIV-1 luciferase reporter proviral vector pNL4–3-lucΔVifΔEnv and pcDNA3.1-Env (EIAV). Cell lysate was analyzed by using Western blotting to detect the intensity of the EIAV Env and HIV CA (p24) protein bands at 48 hpt. Equal numbers of virions in the supernatant were used to infect a HEK293T cell line consistently expressing the equine lentiviral receptor 1 (ELR1) to determine the infectivity of the HIV-EIAV pseudotyped virus. (E) Knockout of SYNJ2BP reduced infectivity of a luciferase-expressing HIV-EIAV pseudotyped reporter virus. ΔSYN or WT HEK293T cells were transfected with HIV-1 luciferase reporter proviral vector pNL4-3-lucΔVifΔEnv and pcDNA3.1-Env (EIAV). Cell lysates and viral infectivity were analyzed as described previously (see panel D). The results of the densitometry analysis to quantify the ratio of Env to β-actin are shown at the bottom (lane 1 set as 1.0). The data in panels D and E represent the means ± the SEM from three independent experiments (***, P < 0.001).

