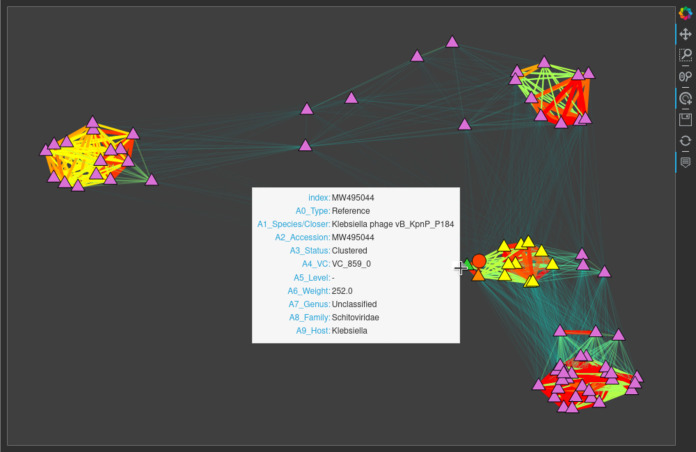
FIG 2.
Interactive subgraph produced by graphanalyzer for a vOTU. Triangles and circles represent reference genomes and vOTU, respectively. This vOTU and the reference genome from which it inherits the taxonomy are depicted in red and green, respectively. Orange nodes are subclustered together with this vOTU, while yellow nodes are only clustered together and belong to a different subcluster. The width and color of edges are proportional to the similarity between two nodes, from thin transparent aquamarine (weaker similarity) to thick opaque red (strongest similarity) shading from green, yellow, and orange in-between. Nodes are positioned approximately respecting the similarity between them, and this tends to make clusters visible at first sight. When opened with a browser, this subgraph is interactive; the user can zoom and drag it and can hover over a node with the mouse to show its properties, like taxonomy classification or cluster type.

