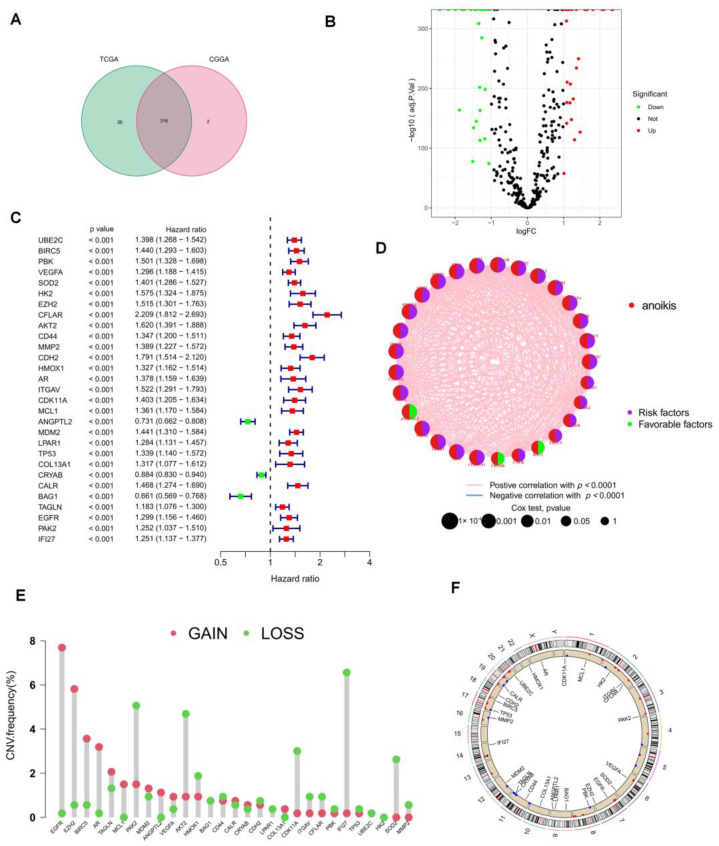
Figure 2.
Characteristics of ANRGs in LGG. (A) Venn diagram showing the 316 ANRGs found from the TCGA and CGGA cohorts. (B) Volcano plot of 57 DEGs in TCGA and GTEx cohort, red for up-regulated, blue for down-regulated genes. (C) The forest plot shows the 29 ANRGs (p < 0.001) via the univariate Cox regression analysis. (D) The network diagram showed the correlations between the top 29ANRGs. The red connecting lines represent positive correlations, while the blue represents negative correlations. (E) Copy number variations (CNVs) of 29 ANRGs in TCGA-LGG. (F) Localization of 29 ANRGs in chromosomal regions.

