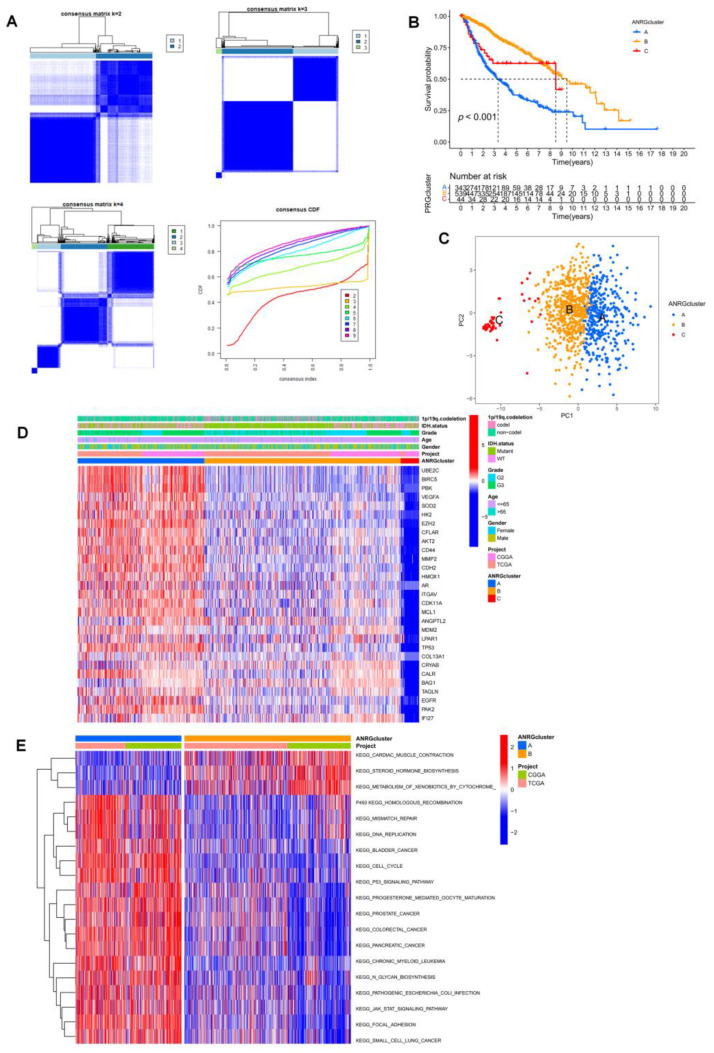
Figure 3.
Subgroups of LGGs associated with 29 ANRGs. (A) The consensus matrix was obtained by applying consensus clustering when k = 2, 3 and 4. When k = 2, the slope of the CDF curve is the lowest. (B) Overall survival of three subtypes (p < 0.001). (C) PCA distinguished three subtypes based on the expression of ANRGs. (D) Heat map of the expression of 29 ANRGs and corresponding clinicopathological features of two subtypes. (E) GSVA analysis focused on the differential enrichment of KEGG pathways between clusters A and B.

