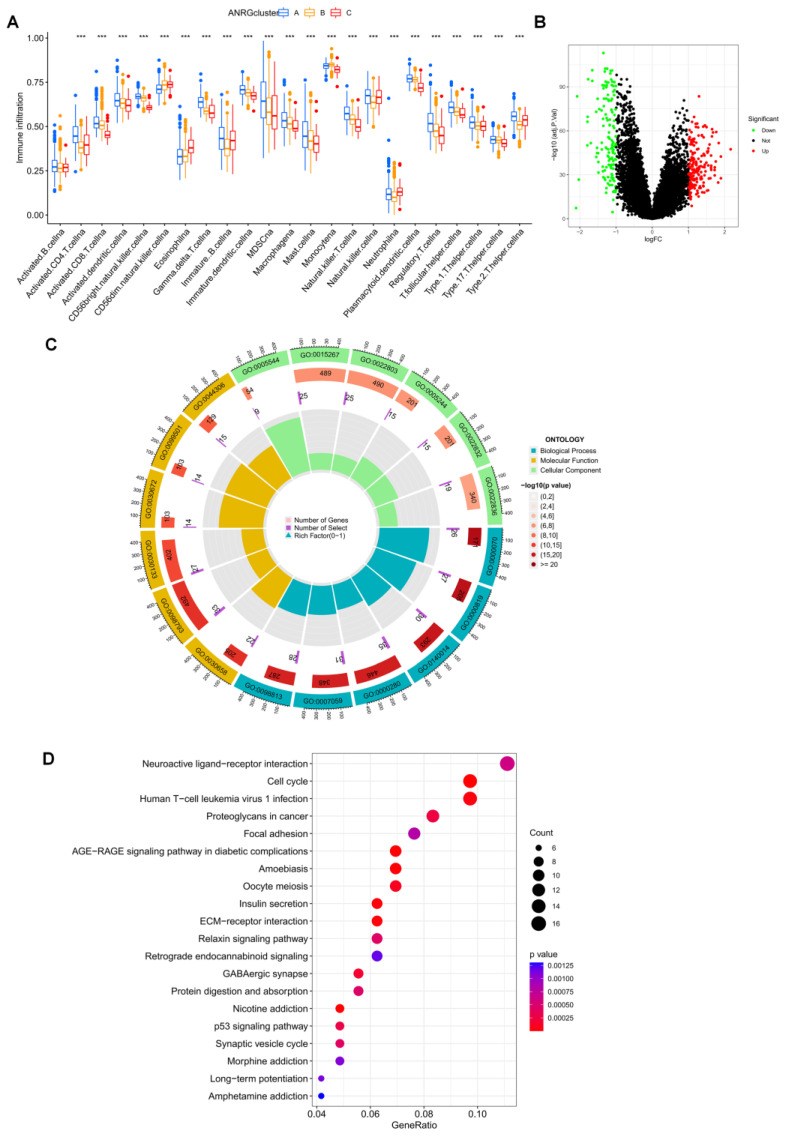
Figure 4.
Differences in immune infiltration patterns and enrichment analysis of DEGs in the three subtype groups. (A) Immune infiltration patterns of three subtype groups were obtained using ssGSEA. (B) Volcano plot of up-and down-regulated DEGs in clusters A and B. (C) GO analysis circle diagram of DEGs. (D) Bubble diagram of KEGG enrichment analysis of DEGs. *** p < 0.001.

