Figure 10.
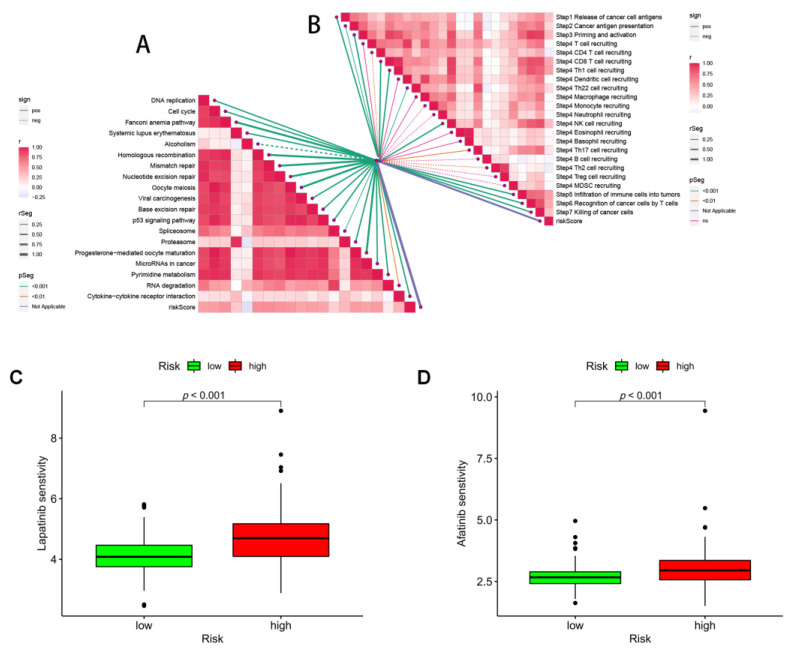
Prediction of immunotherapy and pharmacotherapy for different risk subgroups. (A) Correlation between risk score and ICB response signature, and (B) correlation between risk score and each step of the tumor immune cycle. IC50 values were calculated for patients in the high- and low-risk groups based on lapatinib (C) and afatinib (D) to assess the sensitivity of chemotherapeutic agents.

