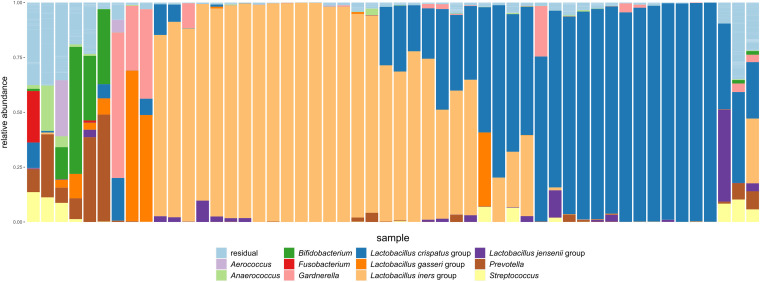
FIG 1.
Taxonomic classification of bacterial communities of baseline samples at visit 1. The relative abundances of the top 11 most abundant taxa at the genus level, or the subgenus level for the Lactobacillus genus, are indicated. All other taxa are grouped as “residual.” Different samples are presented along the x axis, with each stacked bar representing the baseline sample from one woman. Samples are ordered according to similarity by minimizing the Bray-Curtis distance between neighboring samples.

