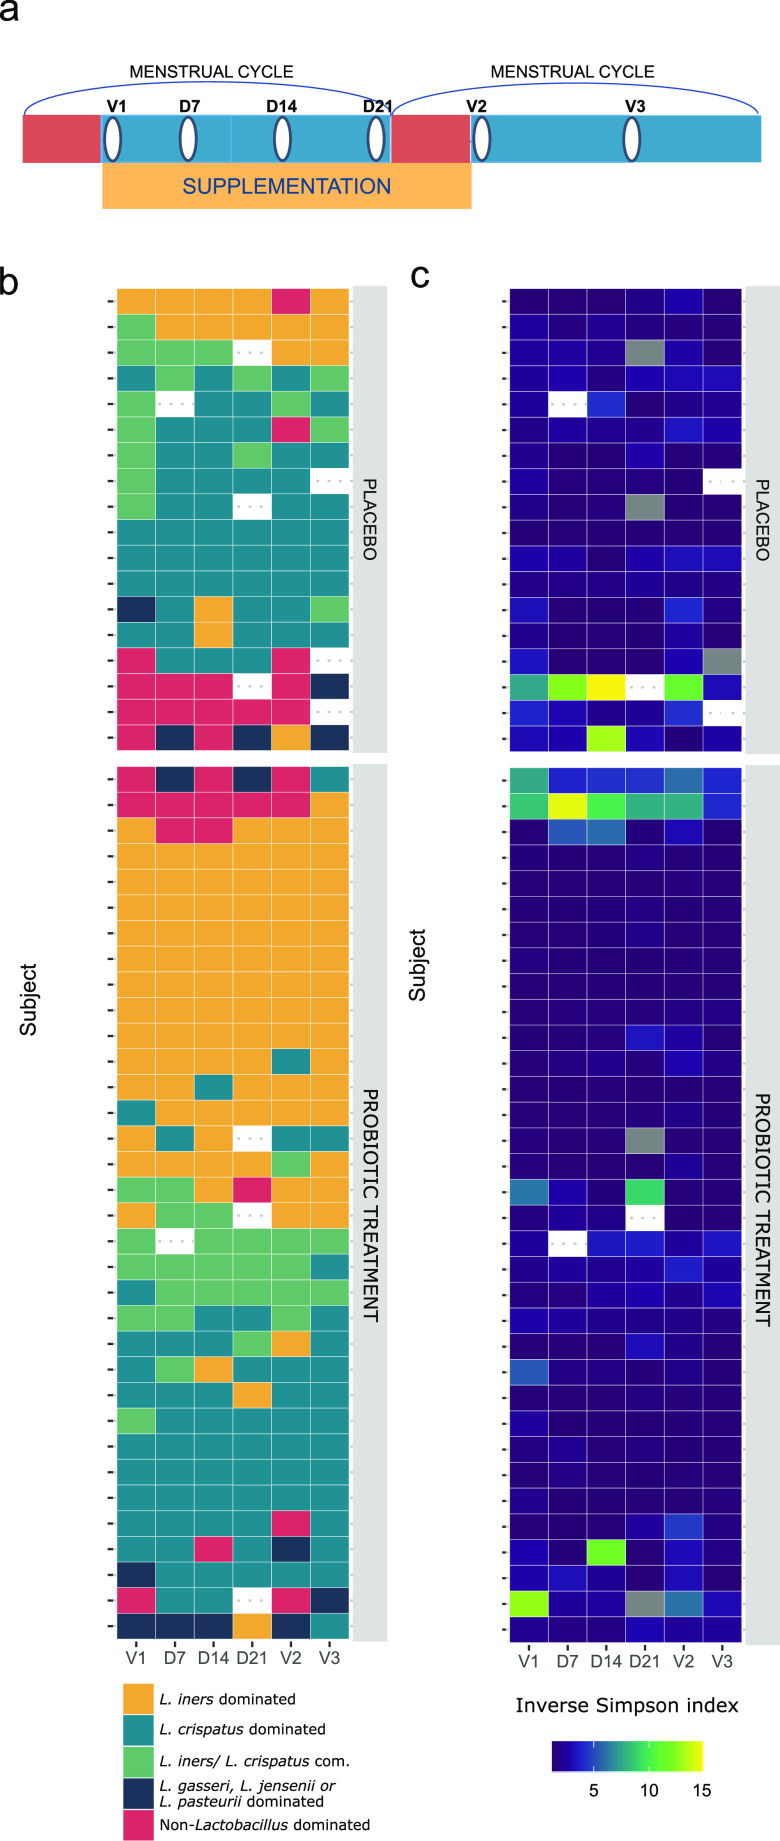
FIG 2.
Analysis of the dominant taxa (or pairs of taxa) and alpha diversity of samples by participant and study group. (a) Schematic showing a simplified timeline of the study. Red bars indicate menstruation, the yellow bar indicates supplementation with the study medication/placebo, and white ovals indicate a sampling time point. (b) The dominant taxa (or pairs of taxa) of each sample ordered by study time point (x axis) and participant (y axis). Colors indicate to which type a certain sample belonged. (c) Alpha diversity of each sample ordered by study time point (x axis) and participant (y axis), based on the inverse Simpson metric. com., combined.

