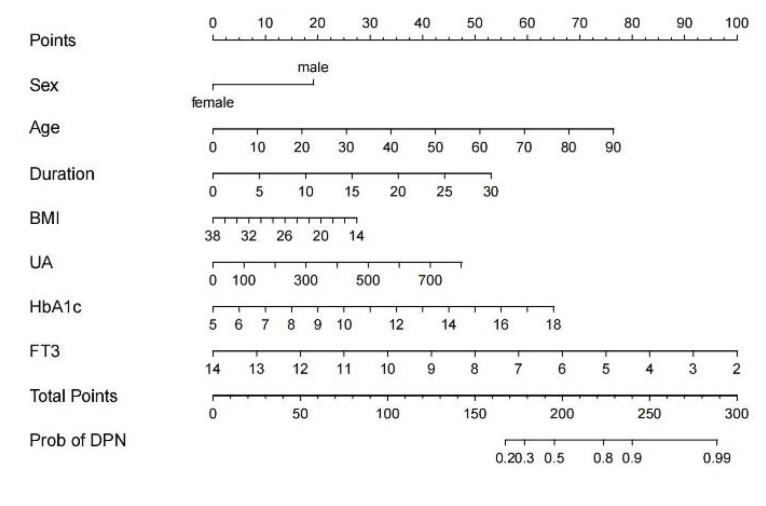
Figure 1.
The nomogram prediction model for DPN risk. Data were collected in patients with type 2 diabetes, and the position of each variable on the corresponding axis was confirmed. A vertical line was drawn from each variable’s position to the top “Points” axis to collect the variable’s score. Then, the users added up the score of each variable to acquire the total score on “Total Points”. They then drew a vertical line from the total points axis to the bottom scale to assess the DPN risk. For example, a 70-year-old (60 points) male (20 points) patient sufferers from a 5-year history of type 2 diabetes (10 points), has 30 kg/m2 of BMI (10 points), 500 umol/L of UA (30 points), 7 of HbA1c (10 points), and 8 pmol/L of FT3 (50 points). He receives a total score of 190 points when all of the points are added. The estimated probability of DPN for this patient was calculated. DPN, Diabetic peripheral neuropathy; BMI, body mass index; UA, uric acid; HbA1c, hemoglobin A1c; FT3, free triiodothyronine.

