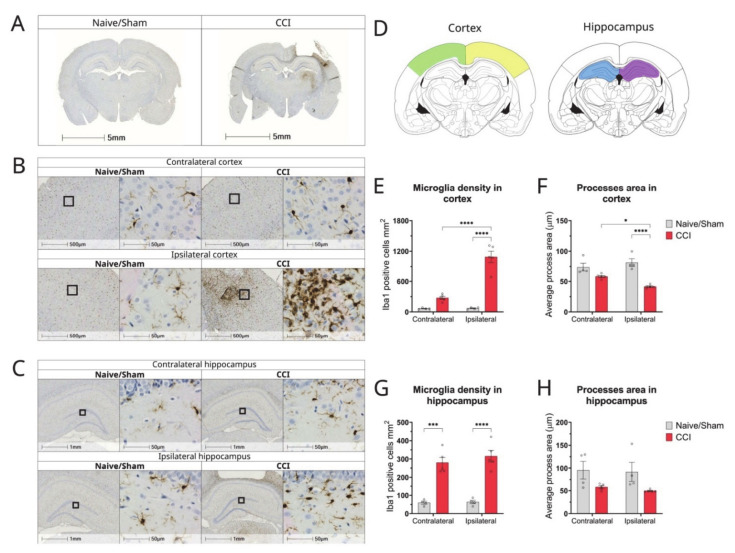
Figure 3.
Changes in microglial density, morphology, and distribution in cortex and hippocampus of CCI rat brains 2 weeks post-injury. (A) Representative whole brain photomicrographs of Iba1 + staining in naïve/control and CCI rat brains; (B) Magnified representative images of the cortex of naïve/sham animals and CCI brains from ipsilateral and contralateral sides of the injury; (C) Magnified representative images of the hippocampus of naïve/sham animals and CCI brains from ipsilateral and contralateral sides of the injury; (D) Brain atlas images, showing areas of cortex and hippocampus analysed; (E) Quantification of the microglia count/mm2 by Iba1 staining in the cortex of CCI and sham/naïve control rats (2-way ANOVA hemisphere F(1,14) = 38.65 p < 0.0001, injury F(1,14) = 86.36 p < 0.0001, interaction F(1,14) = 37.63 p < 0.0001); (F) Average process area per microglia in cortex of CCI and naïve/sham rats (2-way ANOVA hemisphere F(1,14) = 1.129 p = 0.3060, injury F(1,14) = 44.53 p < 0.0001, interaction F(1,14) = 8.569 p = 0.0110); (G) Quantification of the microglia count/mm2 in the hippocampus of CCI and sham/naïve control rats (2-way ANOVA hemisphere F(1,14) = 0.631 p = 0.4402, injury F(1,14) = 9 3.32 p < 0.0001, interaction F(1,14) = 0.409 p = 0.5324); (H) Average process area per microglia in hippocampus of CCI and naïve/sham rats (2-way ANOVA hemisphere F(1,14) = 0.234 p = 0.6357, injury F(1,14) = 9.955 p = 0.0070, interaction F(1,14) = 0.036 p = 0.8522);. All data are presented as mean ± SEM, n = 4–5 per group. Two-way ANOVA, * p < 0.05, *** p < 0.001; **** p < 0.0001. Mouse brain atlas images were obtained from the Allen Institute website (www.alleninstitute.org, accessed on 29 September 2022).

