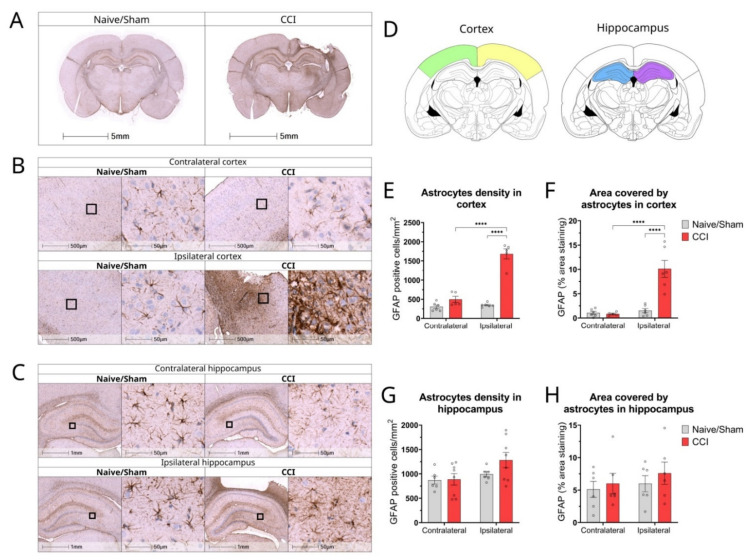
Figure 4.
Changes in astrocyte density, morphology and distribution in cortex and hippocampus of CCI rat brains 2 weeks post-injury. (A) Representative whole brain photomicrographs of GFAP+ staining in naïve/control and CCI rat brains; (B) Magnified representative images of GFAP staining in cortex of naïve/sham animals and CCI brains from ipsilateral and contralateral sides of the injury; (C) Magnified representative images of GFAP staining in the hippocampus of naïve/sham animals and CCI brains from ipsilateral and contralateral sides of the injury; (D) Brain atlas images, showing areas of cortex and hippocampus analysed; (E) Quantification of the GFAP+ cell count/ mm2 in the cortex of CCI and sham/naïve control rats (2-way ANOVA hemisphere F(1,18) = 67.93 p < 0.0001, injury F(1,18) = 104.8 p < 0.0001, interaction F(1,18) = 58.42 p < 0.0001); (F) Quantification of GFAP percentage area covered in the cortex of CCI and sham/naïve control rats (2-way ANOVA hemisphere F(1,19) = 25.57 p < 0.0001, injury F(1,19) = 18.95 p = 0.0003, interaction F(1,19) = 20.88 p = 0.0002); (G) Quantification of the GFAP+ astrocytes count/mm2 in the hippocampus of CCI and sham/naïve control rat (2-way ANOVA hemisphere F(1,24) = 4.515 p = 0.0441, injury F(1,24) = 1.590 p = 0.2194, interaction F(1,24) = 1.259 p = 0.2730); (H) Quantification of GFAP percentage area covered in the hippocampus of CCI and sham/naïve control rats (2-way ANOVA hemisphere F(1,20) = 0.719 p = 0.4063, injury F(1,20) = 0.736 p = 0.4009, interaction F(1,20) = 0.061 p = 0.8071). All data are presented as mean ± SEM, n = 5–8 per group. Two-way ANOVA, **** p < 0.0001. Mouse brain atlas images were obtained from the Allen Institute website (www.alleninstitute.org, accessed on 29 September 2022).

