Figure 6.
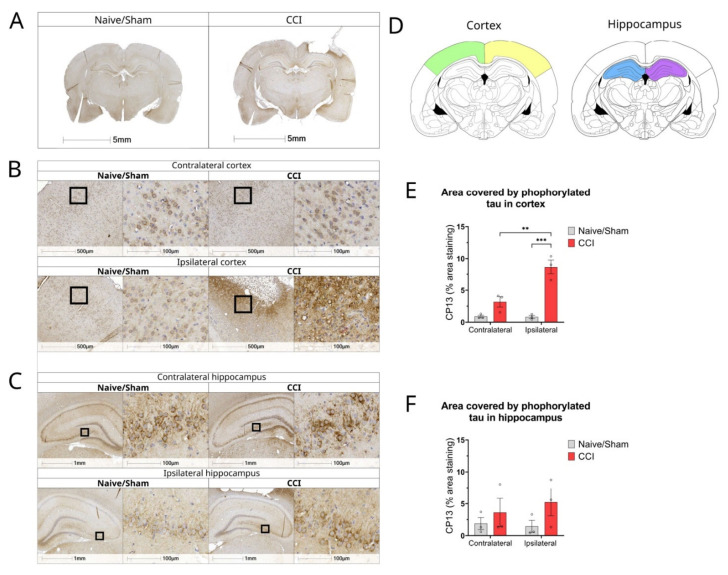
Tau expression is increased in cortex of CCI rat brains 2 weeks post-injury. (A) Representative whole brain photomicrographs of CP13 staining in naïve/control and CCI rat brains; (B) Magnified representative images of CP13 staining in cortex of naïve/sham animals and CCI brains from ipsilateral and contralateral sides of the injury; (C) Magnified representative images of CP13 staining in the hippocampus of naïve/sham animals and CCI brains from ipsilateral and contralateral sides of the injury; (D) Brain atlas images, showing areas of cortex and hippocampus analysed; (E) Quantification of CP13% area stained in the cortex of CCI and sham/naïve control rats (two-way ANOVA hemisphere F(1,8) = 14.68 p = 0.0050, injury F(1,8) = 51.38 p < 0.0001, interaction F(1,8) = 15.44 p = 0.0044); (F) Quantification of CP13% area stained in the hippocampus of CCI and sham/naïve control rat (two-way ANOVA hemisphere F(1,8) = 0.1271 p = 0.7306, injury F(1,8) = 2.696 p = 0.1393, interaction F(1,8) = 0.3704 p = 0.5597);. All data are presented as mean ± SEM, n = 3 per group. Two-way ANOVA, ** p < 0.01 *** p < 0.001. Mouse brain atlas images were obtained from the Allen Institute website (www.alleninstitute.org, accessed on 29 September 2022).

