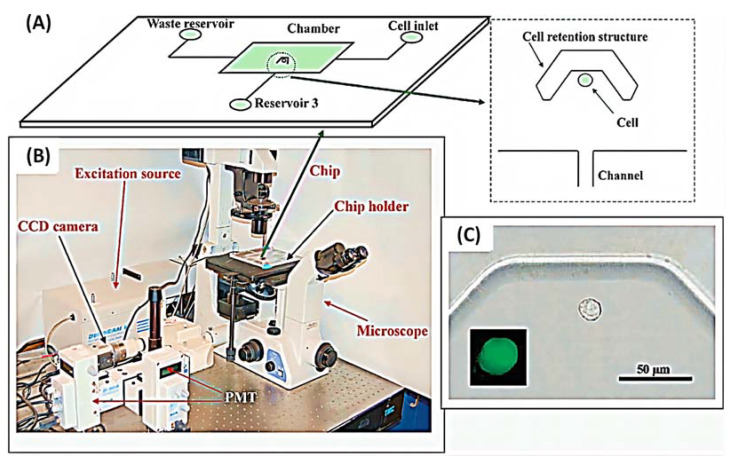
Figure 13.
Schematic diagram of the layout and instrument setup of the Microfluidic chip: (A) Schematic diagram of the Microfluidic chip. (B) Schematic diagram of the instrument setup. (C) Single cells were fixed with a scale bar of 50 mm. The inset shows the fluorescence image of a RAW cell (7 mm in diameter) after stimulation with 10 mg/mL of ionomycin. The image from [14], Copyright 2009, The Royal Society of Chemistry.

