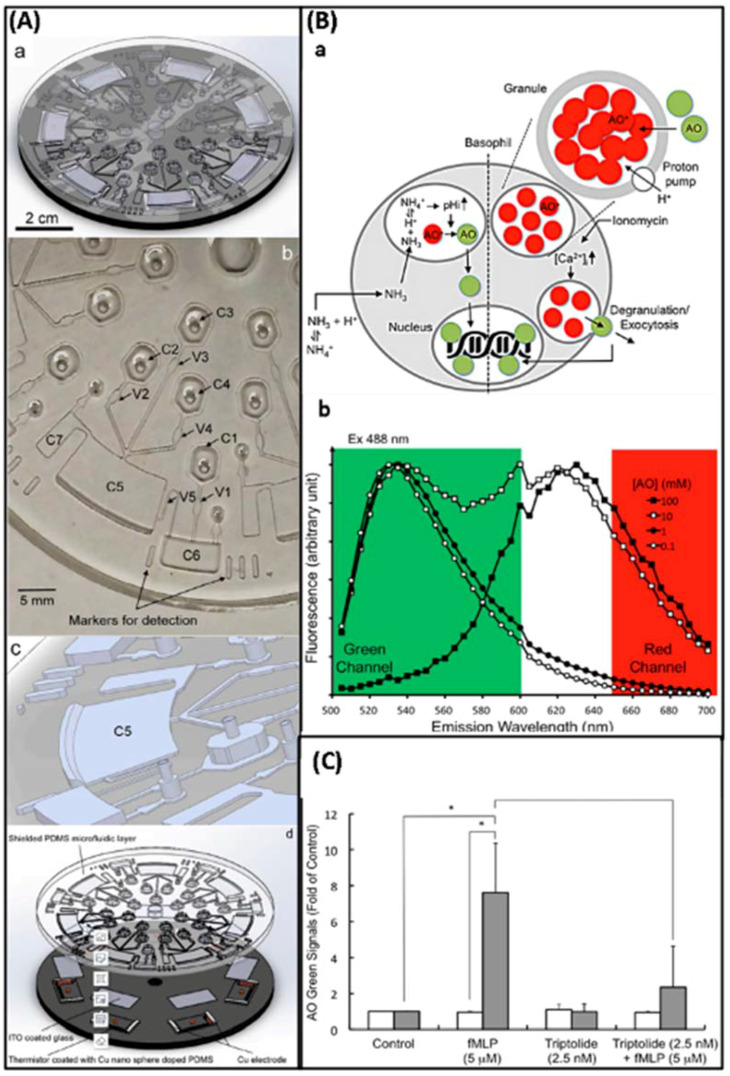
Figure 18.
(Aa) Schematic diagram of the LOAD layout. (Ab) Chambers, channels, valves and siphons for testing allergenicity in one unit. (Ac) A zoom-in diagram showing the flange in C5. (Ad) Assembly of the integrated microfluidic layer. (Ba) Schematic diagram of AO as a degranulation reporter. (Bb) Red-shift phenomenon. (C) Triptolide suppressed the fMLP-mediated AO release in KU-812 cell. The image from [68], Copyright 2016, MDPI.

