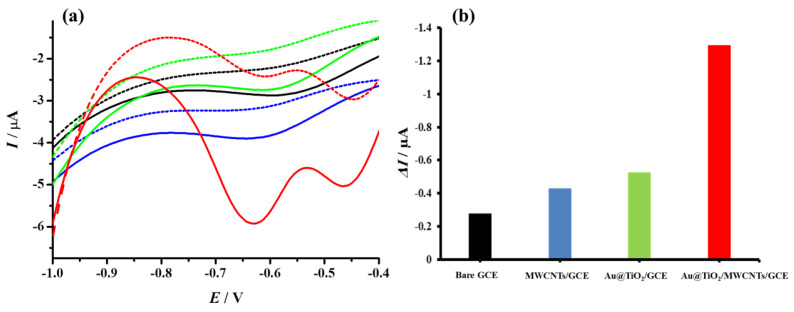
Figure 10.
(a) Differential pulse voltammograms recorded in PBS (dashed lines) and 300 µM H2O2 (solid lines) for various stages of electrode modification, Bare GCE (black); MWCNTs/GCE (blue); Au@TiO2/GCE (green); Au@TiO2/MWCNTs/GCE (red). (b) Histogram represents the corresponding change in current values (ΔI).

