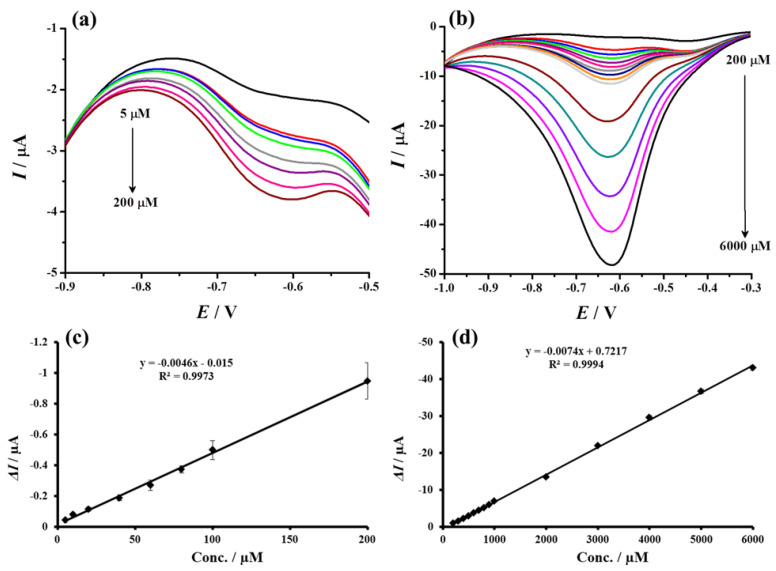
Figure 11.
Differential pulse voltammograms recorded using proposed sensor (Au@TiO2/MWCNTs/GCE towards different concentrations of H2O2 (a) 5 to 200 µM and (b) 200 to 6000 µM) in N2-saturated PBS (pH 7.4)). (c,d) Corresponding calibration curves from the current responses vs. H2O2 concentrations plot.

